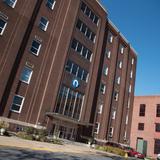

Lehigh Carbon Community College Photo #3

Lehigh Carbon Community College

4525 Education Park Dr
Schnecksville, PA 18078
Top-Ranked (2026-27): View Rankings
  • Lehigh Carbon Community College prepares students with career-focused programs and transfer degrees for those interested in pursuing a bachelor's degree. At LCCC, students who start here can truly go anywhere!

School Highlights

Lehigh Carbon Community College serves 6,221 students (27% of students are full-time).
The college's student-teacher ratio of 29:1 is higher than the state community college average of 22:1.
Minority enrollment is 48% of the student body (majority Hispanic), which is less than the state average of 50%.

Quick Facts (26-27)

  • Enrollment: 6,221 students
  • In-state tuition: $5,280
  • Out-state tuition: $13,320
  • Acceptance Rate: 100%
  • Student-teacher ratio: 29:1
  • Minority enrollment: 48%
  • Source: Verified school update

Top Rankings

Lehigh Carbon Community College ranks among the top 20% of public schools in Pennsylvania for:

Category
Attribute
Affordability
Community Size

School Overview

The teacher population of 213 teachers has declined by 52% over five years.
Lehigh Carbon Community College
(PA) Community College Avg.
Carnegie Classification
Associate's Colleges
Associate's Colleges: High Transfer-High Traditional
Institution Level
At least 2 but less than 4 years
Institution Control
Public
Private not-for-profit
Year Founded
1966
Campus Size
254 acres
Total Faculty
213 staff
28 staff
School Calendar

Student Body

The student population of Lehigh Carbon Community College has stayed relatively flat over five years.
The student-teacher ratio of 29:1 has increased from 14:1 over five years.
The Lehigh Carbon Community College diversity score of 0.64 is less than the state average of 0.69. The school's diversity has grown by 7% over five years.
Total Enrollment
6,221 students
382 students

Showing 2012–2025. Full 19-year historical data available below ↓

Student-Teacher Ratio
29:1
22:1
# Full-Time Students
1,668 students
294 students

Showing 2012–2025. Full 19-year historical data available below ↓

# Part-Time Students
4,553 students
88 students

Showing 2012–2025. Full 19-year historical data available below ↓

# Enrollment Undergraduate
6,221 students
370 students
# Full-Time Undergraduate Students
1,668 students
292 students

Showing 2012–2025. Full 19-year historical data available below ↓

# Part-Time Undergraduate Students
4,553 students
88 students
% American Indian/Alaskan
1%
n/a
% Asian
3%
4%

Showing 2008–2025. Full 19-year historical data available below ↓

% Hispanic
29%
12%

Showing 2010–2025. Full 19-year historical data available below ↓

% Black
8%
15%

Showing 2010–2025. Full 19-year historical data available below ↓

% White
52%
50%

Showing 2010–2025. Full 19-year historical data available below ↓

% Two or more races
2%
4%
% Unknown races
4%
14%
Diversity Score
0.64
0.69

Showing 2011–2025. Full 19-year historical data available below ↓

College Completion Rate (Students who graduate in less than 4 years)
21%
61%

Showing 2015–2025. Full 19-year historical data available below ↓

Average Graduate Earnings (10 Years)
$34,900
$36,700

Tuition & Financial Aid

The public in-state tuition of $5,280 is less than the state average of $11,161. The in-state tuition has declined by 37% over four years.
The public out-state tuition of $13,320 is less than the state average of $16,403. The out-state tuition has grown by 10% over four years.
In-State Tuition Fees
$5,280
$11,161
Out-State Tuition Fees
$13,320
$16,403

Showing 2010–2025. Full 19-year historical data available below ↓

Tuition Notes
Annual
% Students Receiving Some Financial Aid
79%
89%

Showing 2011–2025. Full 19-year historical data available below ↓

Median Debt for Graduates
$11,000
$13,310

Showing 2008–2020. Full 14-year historical data available below ↓

Median Debt for Dropouts
$5,500
$6,297

Showing 2008–2020. Full 14-year historical data available below ↓

Acceptance Rate
100%
82%

Sports

Total Sports Offered
5 sports
Sports
BaseballBasketball
SoccerSoftball
Volleyball
Source: 2025 (or latest year available) Integrated Postsecondary Education Data System (IPEDS) , School Administrators

School Notes

  • Founded in 1966, Lehigh Carbon Community College serves nearly 10,000 students from Lehigh, Carbon, Schuylkill and surrounding counties offering more than 90 programs of study including healthcare, information technology, criminal justice, education and business administration. From the main campus in Schnecksville and modern sites in Allentown, Tamaqua and Lehigh Valley International Airport, Lehigh Carbon offers two-year associate degrees, certificate and specialized diploma programs, and workforce training for students studying either full-time, part-time or online.

Frequently Asked Questions

How much does Lehigh Carbon Community College cost?
Lehigh Carbon Community College's tuition is approximately $5,280 for In-State students and $13,320 for Out-State students.
What is the acceptance rate of Lehigh Carbon Community College?
The acceptance rate of Lehigh Carbon Community College is 100%, which is higher than the state average of 82%.
What sports does Lehigh Carbon Community College offer?
Lehigh Carbon Community College offers 5 interscholastic sports: Baseball, Basketball, Soccer, Softball and Volleyball.
What is Lehigh Carbon Community College's ranking?
Lehigh Carbon Community College ranks among the top 20% of community college in Pennsylvania for: Least expensive tuition, Largest student body and Least debt for graduating students.

Recent Articles

Will Your Community College GPA Follow You After Transfer?
Will your community college GPA follow you after transfer? Learn how university grades, transcripts, scholarships, graduate admissions, and academic standing may be affected by your previous college performance.
The Transfer Catalog-Year Trap: What Students Must Check
Could university requirements change before you transfer? Learn how catalog years, continuous enrollment, and degree rules affect your pathway, and what students should verify before choosing university courses.
Transfer Agreements: Admission vs. Your Major
Does your transfer agreement guarantee admission to your major? Discover what happens when universities accept transfer students but restrict entry to specific academic programs and degrees after admission.

Quick Facts (26-27)

  • Enrollment: 6,221 students
  • In-state tuition: $5,280
  • Out-state tuition: $13,320
  • Acceptance Rate: 100%
  • Student-teacher ratio: 29:1
  • Minority enrollment: 48%
  • Source: Verified school update

Related School Videos

Quick Links