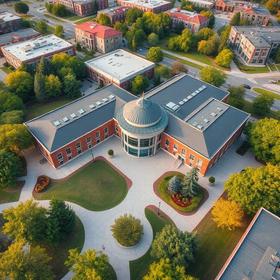
- Laney College, in the heart of vibrant, multicultural downtown Oakland, features the cosmopolitan atmosphere and human energy of a big-city university. Across the street from the Oakland Museum of California, blocks from historic Chinatown, and a pleasant stroll from both Lake Merritt and the Oakland Estuary, Laney gives its 12,000-plus students ready access to the city's formidable intellectual, cultural, and natural resources. With renowned programs in such fields as Journalism, Culinary Arts, Mathematics, Machine Technology, and Ethnic Studies, Laney has been a leader in academic and vocational education for decades. A talented faculty and dedicated staff, not to mention a new state-of-the-art technology center, ensure that Laney will remain at the forefront of Information Age community education for years to come.
School Highlights
Laney College serves 15,913 students (13% of students are full-time).
The college's student-teacher ratio of 45:1 is higher than the state community college average of 32:1.
Minority enrollment is 84% of the student body (majority Hispanic and Asian), which is more than the state average of 77%.
Quick Facts (2026)
- Enrollment: 15,913 students
- In-state tuition: $1,144
- Out-state tuition: $6,256
- Acceptance Rate: 25%
- Student-teacher ratio: 45:1
- Minority enrollment: 84%
- Source: Integrated Postsecondary Education Data System (IPEDS)
Top Rankings
Laney College ranks among the top 20% of public schools in California for:
School Overview
The teacher population of 354 teachers has stayed relatively flat over five years.
Laney College
(CA) Community College Avg.
Carnegie Classification
Associate's Colleges: Mixed Transfer/Career & Technical-High Nontraditional
Baccalaureate/Associate's Colleges: Associate's Dominant
Institution Level
Less than 2 yrs
At least 2 but less than 4 years
Institution Control
Public
Public
Total Faculty
354 staff
315 staff
School Calendar
Student Body
The student population of Laney College has grown by 72% over five years.
The student-teacher ratio of 45:1 has decreased from 46:1 over five years.
The Laney College diversity score of 0.80 is more than the state average of 0.70. The school's diversity has stayed relatively flat over five years.
Total Enrollment
15,913 students
9,796 students
Student-Teacher Ratio
45:1
32:1
# Full-Time Students
2,057 students
1,259 students
# Part-Time Students
13,856 students
8,537 students
# Enrollment Undergraduate
159 students
242 students
# Full-Time Undergraduate Students
2,057 students
1,250 students
# Full-Time Graduate Students
n/a
63 students
# Part-Time Undergraduate Students
n/a
8,299 students
# Part-Time Graduate Students
n/a
10 students
Total Dormitory Capacity
n/a
121 students
% American Indian/Alaskan
n/a
n/a
% Asian
22%
13%
% Hispanic
29%
47%
% Black
20%
7%
% White
16%
23%
% Hawaiian
1%
1%
% Two or more races
6%
5%
% Non Resident races
1%
1%
% Unknown races
4%
3%
Diversity Score
0.80
0.70
College Completion Rate (Students who graduate in less than 4 years)
27%
42%
College Completion Rate (Students who graduate in 4 years or more than 4 years)
n/a
43%
Average Graduate Earnings (10 Years)
$33,700
$34,700
Tuition and Acceptance Rate
The public in-state tuition of $1,144 is less than the state average of $1,516. The in-state tuition has stayed relatively flat over four years.
The public out-state tuition of $6,256 is less than the state average of $6,779. The out-state tuition has declined by 16% over four years.
In-State Tuition Fees
$1,144
$1,516
Out-State Tuition Fees
$6,256
$6,779
Tuition Notes
$1,104 per semester unit
% Students Receiving Some Financial Aid
59%
85%
Median Debt for Graduates
$9,000
$10,376
Median Debt for Dropouts
$8,500
$6,239
Acceptance Rate
25%
93%
Source: 2024 (or latest year available) Integrated Postsecondary Education Data System (IPEDS) , School Administrators
School Notes
- School Mascot: Eagle
- Laney is the largest of the four colleges (13,000 students) in the Peralta Community College District, which serves the six cities of Northern Alameda County (Alameda, Albany, Berkeley, Emeryville, Oakland and Piedmont). Ours is a unique institution, and we are fiercely proud of its long history and ongoing commitment to service. A crucial part of that commitment is ensuring the quality of your education as well as your overall campus experience. Our success, after all, is inseparable from yours and student learning is our first priority. The Laney college campus, which opened in 1970, is a vibrant and safe environment in a central location in downtown Oakland on 60 acres of land. Laney is across the street from the Oakland Museum and the Henry J. Kaiser Convention Center. We are also one block from the Lake Merritt Bay Area Rapid Transit (BART) station and two blocks from the Alameda County Courthouse and beautiful Lake Merritt. The campus is in walking distance to Oakland's Chinatown and is easily accessible to the famous Jack London Square Laney is well known for its outstanding student newspaper, the Laney Tower; its Transfer Opportunity Center; and its array of quality academic and occupational course offerings. In addition, Associate degrees are offered in more than twenty (20) Liberal Arts and Science fields. Laney transfers more students per year to UC Berkeley than any other college of its size in the United States. Many other Laney students transfer to California State University campuses, local and out-of-state independent institutions and historically black colleges and universities. The faculty and staff are our campus' greatest asset. Laney's wonderful diversity, set in the midst of a lively urban center, makes it particularly wealthy in human potential.Laney is a vibrant campus with a comprehensive educational offering, where students are challenged and inspired to actualize their highest potential.
Frequently Asked Questions
How much does Laney College cost?
Laney College's tuition is approximately $1,144 for In-State students and $6,256 for Out-State students.
What is the acceptance rate of Laney College?
The acceptance rate of Laney College is 25%, which is lower than the state average of 93%. Laney College's acceptance rate is ranked among the top community colleges in California with low acceptance rates.
What is Laney College's ranking?
Laney College ranks among the top 20% of community college in California for: Lowest acceptance rates and Diversity in US community colleges.
In what neighborhood is Laney College located?
Laney College is located in the Downtown Oakland neighborhood of Oakland, CA.
Recent Articles

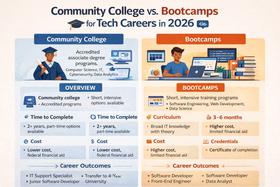
Community College vs. Bootcamps for Tech Careers in 2026
Community college vs. bootcamps in 2026. Compare cost, outcomes, credentials, and hiring trends to choose the best tech career path.

How to Build a Class Schedule That Fits Your Life (Spring 2026)
Learn how to build a class schedule that fits your life with expert tips, updated strategies for Spring 2026, and practical planning tools for students and families.

Top 10 Jobs for Community College Graduates in 2026
Meta Description: Discover high-demand jobs for community college graduates, with current salary trends, costs, and career pathways.


