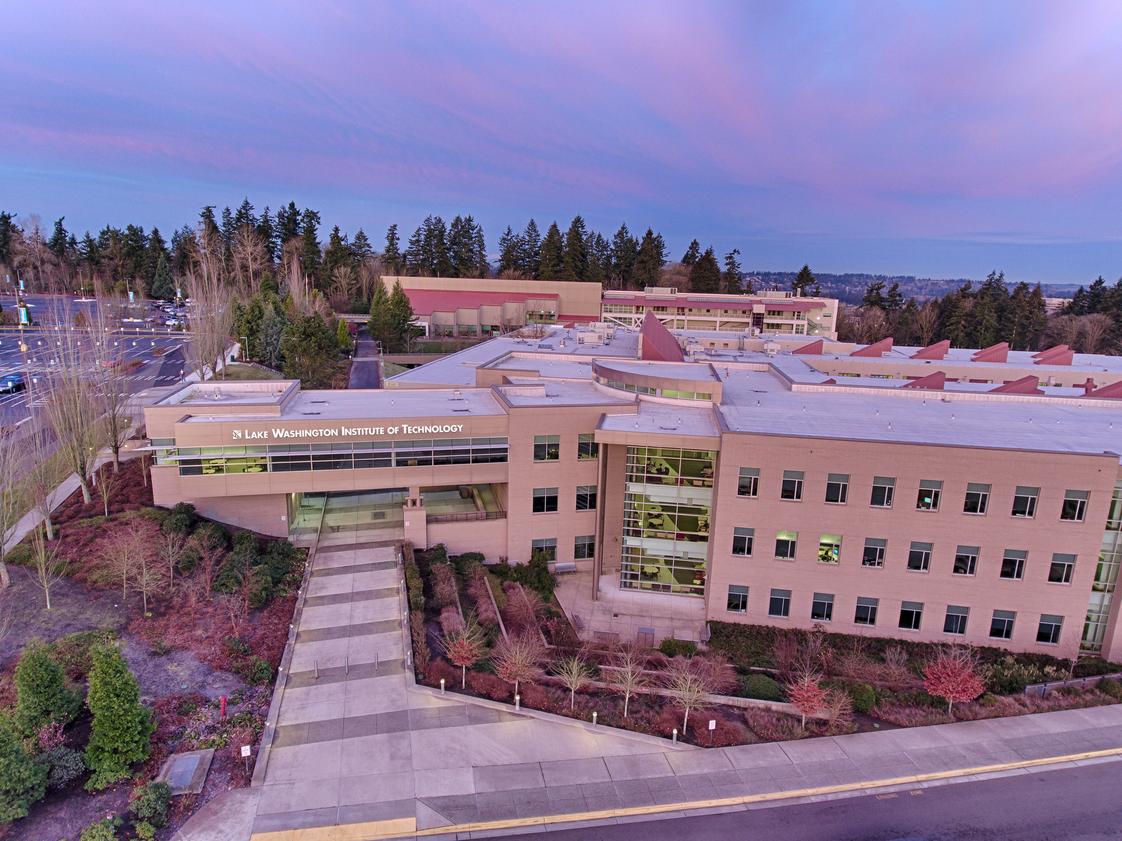
Located just outside of Seattle, WA, Lake Washington Institute of Technology (LWTech) was founded in 1949, and is the only public institute of technology in the state of Washington. LWTech offers six bachelor`s degrees, 47 associate degrees, and 89 professional certificates in 44 areas of study, including STEM-focused programs in Science, Technology, Engineering and Math.
LWTech directly serves the communities of Kirkland, Redmond, Bellevue, Kenmore, Mercer Island, Bothell, Woodinville, Carnation, Duvall, North Bend, Fall City, Sammamish, Issaquah, Snoqualmie, Skykomish, Clyde Hill, and Medina. LWTech also serves students from outside our service area, as well as students from around the world
School Highlights
Lake Washington Institute of Technology serves 3,564 students (49% of students are full-time).
The college's student-teacher ratio of 21:1 is lower than the state community college average of 24:1.
Minority enrollment is 62% of the student body (majority Hispanic and Asian), which is more than the state average of 60%.
Quick Facts (2026)
Enrollment: 3,564 students
Student-teacher ratio: 21:1
Minority enrollment: 62%
Source: Verified school update
School Overview
The teacher population of 167 teachers has declined by 44% over five years.
Note: Data may not be displayed on any public-facing website or service that replicates or resembles a college search or review portal without prior written permission. See our Terms of Service.
Student Body
The student population of Lake Washington Institute of Technology has stayed relatively flat over five years.
The student-teacher ratio of 21:1 has increased from 12:1 over five years.
The Lake Washington Institute of Technology diversity score of 0.78 is more than the state average of 0.00. The school's diversity has grown by 8% over five years.
Note: Data may not be displayed on any public-facing website or service that replicates or resembles a college search or review portal without prior written permission. See our Terms of Service.
Note: Data may not be displayed on any public-facing website or service that replicates or resembles a college search or review portal without prior written permission. See our Terms of Service.
Note: Data may not be displayed on any public-facing website or service that replicates or resembles a college search or review portal without prior written permission. See our Terms of Service.
Note: Data may not be displayed on any public-facing website or service that replicates or resembles a college search or review portal without prior written permission. See our Terms of Service.
Note: Data may not be displayed on any public-facing website or service that replicates or resembles a college search or review portal without prior written permission. See our Terms of Service.
Note: Data may not be displayed on any public-facing website or service that replicates or resembles a college search or review portal without prior written permission. See our Terms of Service.
Note: Data may not be displayed on any public-facing website or service that replicates or resembles a college search or review portal without prior written permission. See our Terms of Service.
Note: Data may not be displayed on any public-facing website or service that replicates or resembles a college search or review portal without prior written permission. See our Terms of Service.
Note: Data may not be displayed on any public-facing website or service that replicates or resembles a college search or review portal without prior written permission. See our Terms of Service.
Note: Data may not be displayed on any public-facing website or service that replicates or resembles a college search or review portal without prior written permission. See our Terms of Service.
Note: Data may not be displayed on any public-facing website or service that replicates or resembles a college search or review portal without prior written permission. See our Terms of Service.
Note: Data may not be displayed on any public-facing website or service that replicates or resembles a college search or review portal without prior written permission. See our Terms of Service.
College Completion Rate (Students who graduate in less than 4 years)
Note: Data may not be displayed on any public-facing website or service that replicates or resembles a college search or review portal without prior written permission. See our Terms of Service.
College Completion Rate (Students who graduate in 4 years or more than 4 years)
Note: Data may not be displayed on any public-facing website or service that replicates or resembles a college search or review portal without prior written permission. See our Terms of Service.
Note: Data may not be displayed on any public-facing website or service that replicates or resembles a college search or review portal without prior written permission. See our Terms of Service.
Note: Data may not be displayed on any public-facing website or service that replicates or resembles a college search or review portal without prior written permission. See our Terms of Service.
Note: Data may not be displayed on any public-facing website or service that replicates or resembles a college search or review portal without prior written permission. See our Terms of Service.
Note: Data may not be displayed on any public-facing website or service that replicates or resembles a college search or review portal without prior written permission. See our Terms of Service.
Source: 2025 (or latest year available) Integrated Postsecondary Education Data System (IPEDS) , School Administrators
School Notes
Lake Washington Institute of Technology, in Kirkland's Totem
Lake area, serves local students from King and Snohomish counties,
commuter students from areas like Port Townsend, Gig Harbor and
Marysville, and international students from around the globe,
including Japan, Tonga, Ireland, Indonesia and the Ukraine. Lake
Washington Institute of Technology officially became part of the
new community and technical college system on September 1, 1991;
the institute became a degree-granting technical college with all
the rights and responsibilities of a technical college as
prescribed by state law. During the next three years the college
replaced its two-year diplomas with Associate of Applied Science
degrees. Twenty Association of Applied Science degrees were
approved by the State Board of Community and Technical Colleges to
be offered to students by the college. LWTech offers the
cutting-edge, professional career and technical training needed to
rapidly and affordably qualify our students for opportunities in
today's job market. With training opportunities in over 100 degree
and certificate options in 39 programs, we have something for
everyone - including some Bachelor degrees. Adult education
programs are also offered. Lake Washington Institute of Technology
is accredited by the Northwest Commission on Colleges and
Universities (NWCCU).
Learn how Credit for Prior Learning (CPL) can help community college students earn college credit for military service, work experience, certifications, and prior learning, reducing both the time and cost of earning a degree.
Discover how to evaluate whether your work schedule is compatible with community college before classes begin, and learn practical strategies that help working students stay on track toward graduation.
Learn how to identify community colleges that actively reduce stop-out risk through proactive advising, financial support, transfer pathways, flexible scheduling, and student success services, helping you stay enrolled, complete your credential, and achieve your long-term educational goals.


![Lake Washington Institute of Technology - Virtual Walking Tour [4k 60fps]](https://i.ytimg.com/vi/eunzua5Yyq4/0.jpg "Walking around Lake Washington Institute of Technology (LWTech) campus on a cloudy weekday afternoon. This is a public community college located in Kirkland, WA.
Thanks for watching! I hope you enjoy the video!
Please like and subscribe to the channel to help the channel grow : )
Comments or suggestions on the video?
Want to see more universities/colleges?
Leave a comment below and I will take you there, virtually! XD
--------------------------------------------------
Brief intro of Lake Washington Institute of Technology:
The Lake Washington Institute of Technology (LWTech) is a public community college of technology in Kirkland, Washington. LWTech is a member of the Washington State Board for Community and Technical Colleges and offers bachelor's degrees, associate degrees, and professional certificates in more than 40 areas of study.
In addition to regular enrollment, LWTech offers a Technical Academy, a full-time special purpose high school program giving qualifying students, ages 16 to 20, an opportunity to complete their high school diploma and to earn a two-year college technical degree at the same time. Other high school programs include, Running Start, Open Doors, Tech Prep, Adult High School Completion, and WANIC. In addition to high school diplomas, these students can also earn associate degrees.
LWTech has one of the highest completion rates in the State of Washington.
Ref: https://en.wikipedia.org/wiki/Lake_Washington_Institute_of_Technology
Lake Washington Institute of Technology website: https://www.lwtech.edu/
#LakeWashingtonInstituteOfTechnology #LWTech #LakeWashington #Kirkland #WashingtonState #Seattle #CampusTour #VirtualWalkingTour")
 is required at Lake Washington Institute of Technology (LWTech) for all students seeking a certificate of proficiency or associate degree. The required course dives deep into concepts of diversity and social justice. This requirement does not add costs to degree requirements and no additional time is needed to meet degree requirements.
Visit LWTech.edu/DSJ for more information about DSJ courses at LWTech.
PowerPoint deck slides in video can be downloaded at: LWTech.edu/academics/diversity-social-justice-requirement/docs/lwtech-dsj-presentation-slides.pdf")


