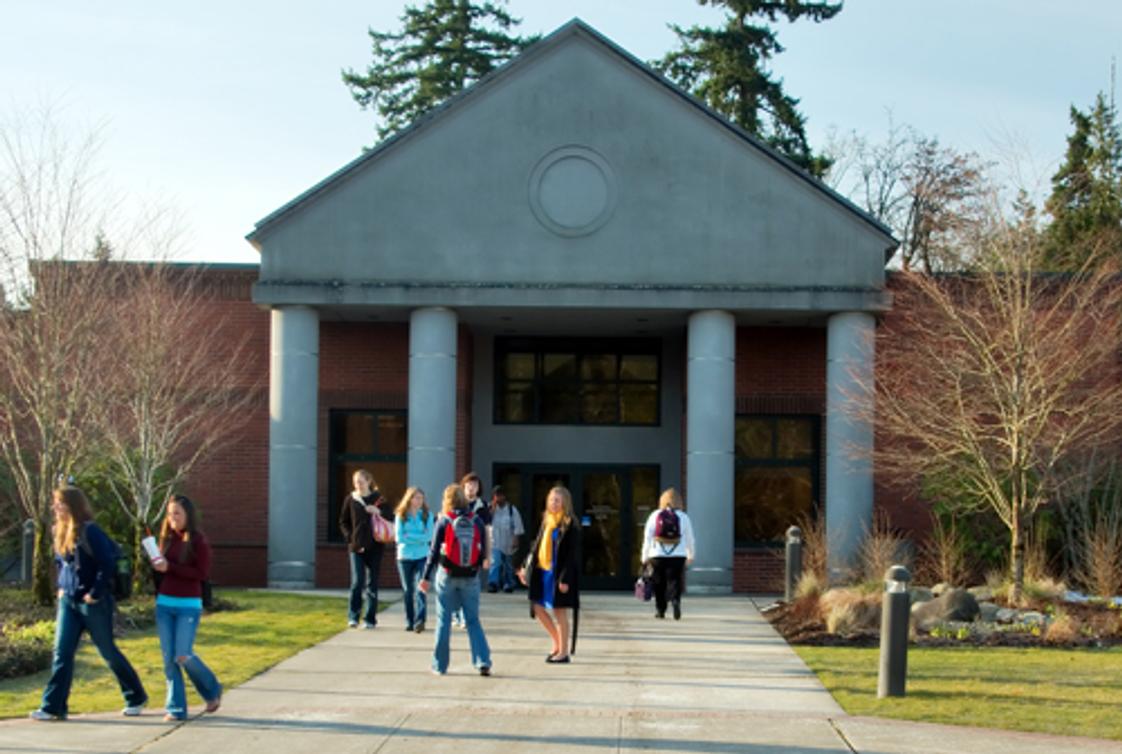
- Pierce College Fort Steilacoom and Pierce College Puyallup are comprehensive, accredited, public two-year colleges. Our colleges offer outstanding programs for career development and transfer to four-year colleges, in beautiful settings, with excellent facilities and instructors.
School Highlights
Pierce College District serves 10,153 students (55% of students are full-time).
The college's student-teacher ratio of 29:1 is higher than the state community college average of 15:1.
Minority enrollment is 56% of the student body (majority Hispanic and Black), which is equal to the state average of 56%.
Quick Facts (2026)
- Enrollment: 10,153 students
- In-state tuition: $3,777
- Out-state tuition: $8,967
- Acceptance Rate: 75%
- Student-teacher ratio: 29:1
- Minority enrollment: 56%
- Source: Integrated Postsecondary Education Data System (IPEDS)
Top Rankings
Pierce College District ranks among the top 20% of public schools in Washington for:
Category
Attribute
Community Size
School Overview
The teacher population of 353 teachers has stayed relatively flat over five years.
Pierce College District
(WA) Community College Avg.
Carnegie Classification
Baccalaureate/Associate's Colleges: Associate's Dominant
Baccalaureate/Associate's Colleges: Associate's Dominant
Institution Level
Four or more years
Four or more years
Institution Control
Public
Public
Total Faculty
353 staff
353 staff
School Calendar
Student Body
The student population of Pierce College District has grown by 21% over five years.
The student-teacher ratio of 29:1 has decreased from 69:1 over five years.
The Pierce College District diversity score of 0.74 is less than the state average of 0.75. The school's diversity has stayed relatively flat over five years.
Total Enrollment
10,153 students
5,207 students
Student-Teacher Ratio
29:1
15:1
# Full-Time Students
5,591 students
2,028 students
# Part-Time Students
4,562 students
3,179 students
# Enrollment Undergraduate
101 students
494 students
# Full-Time Undergraduate Students
5,591 students
2,028 students
# Part-Time Undergraduate Students
4,562 students
3,179 students
Total Dormitory Capacity
60 students
140 students
% American Indian/Alaskan
n/a
1%
% Asian
8%
10%
% Hispanic
18%
17%
% Black
10%
7%
% White
44%
44%
% Hawaiian
2%
1%
% Two or more races
12%
8%
% Non Resident races
2%
3%
% Unknown races
3%
9%
Diversity Score
0.74
0.75
College Completion Rate (Students who graduate in less than 4 years)
24%
30%
College Completion Rate (Students who graduate in 4 years or more than 4 years)
38%
36%
Average Graduate Earnings (10 Years)
$37,900
$36,400
Tuition and Acceptance Rate
The public in-state tuition of $3,777 is less than the state average of $4,105. The in-state tuition has declined by 9% over four years.
The public out-state tuition of $8,967 is more than the state average of $7,359. The out-state tuition has grown by 93% over four years.
In-State Tuition Fees
$3,777
$4,105
Out-State Tuition Fees
$8,967
$7,359
% Students Receiving Some Financial Aid
39%
58%
Median Debt for Graduates
$13,296
$11,794
Median Debt for Dropouts
$7,000
$6,192
Acceptance Rate
75%
99%
Source: 2024 (or latest year available) Integrated Postsecondary Education Data System (IPEDS) , School Administrators
School Notes
- Pierce College District 11 is two community colleges and an extended learning program in Pierce County, Washington state. Pierce is one of the largest educational providers in the state, and is nationally ranked in degrees conferred. Our programs include transfer courses parallel to the first two years of university and four-year college work, vocational degree and certificate programs for training or retraining in a variety of job fields, developmental, basic skills and high school completion courses, personal and professional development through continuing education courses and traditional and non-traditional learning opportunities. Pierce College's rise to prominence in Washington's higher education system began humbly. It opened in 1967 as Clover Park Community College, and its administrative offices and library were housed in an abandoned grocery store. A local school district operated the college, and instructors held classes throughout Pierce County at area high schools, military bases and hospitals. In its first year of operation, the college became part of the statewide community college system. With support of the state legislature, which passed the Community College Act of 1967, a permanent campus was chosen. The site, 140 acres in the historic Fort Steilacoom area of Lakewood, led to a new name: Fort Steilacoom Community College. With a strong reputation for solid, affordable educational programs, the college continued to grow rapidly. A major addition and remodeling of the Fort Steilacoom campus were complete in 1987. At the same time, an 85-acre site in Puyallup was purchased to become the permanent home of the Puyallup campus. Officials broke ground for the first building in 1989 and at the start of fall quarter 1990 held the facility's grand opening. A second building was opened in Puyallup in the Fall of 1996. Pierce College offers a variety of associate degrees for university transfer, Associate in Technology degrees for professional/technical training in a wide range of career fields, and professional/technical certificates for entry-level employment preparation. Pierce College is accredited by the Northwest Association of Schools and Colleges and the Washington State Board for Community and Technical Colleges. It is part of the state system of public community and technical colleges.
Frequently Asked Questions
How much does Pierce College District cost?
Pierce College District's tuition is approximately $3,777 for In-State students and $8,967 for Out-State students.
What schools are Pierce College District often compared to?
Pierce College Districtis often viewed alongside schools like Tacoma Community College by visitors of our site.
What is the acceptance rate of Pierce College District?
The acceptance rate of Pierce College District is 75%, which is lower than the state average of 99%.
What is Pierce College District's ranking?
Pierce College District ranks among the top 20% of community college in Washington for: Largest student body.
Recent Articles

Community College Policies and Financial Aid Guide 2026
A 2026 guide to community college policies and financial aid, including FAFSA updates, state aid, tuition rules, and smart planning tips.

Get Better Grades in Community College by Being Social (2026 Update)
Learn how being social in community college boosts grades, retention, and career success. Updated 2026 strategies for academic achievement.

Navigating Community College as an Adult Learner in 2026
A practical 2026 guide for adults returning to community college, covering admissions, financial aid, career planning, and flexible learning options.


