- Since 1973 Pennco Tech has been helping people achieve their goals. Pennco Tech has a long history of being the stepping stone people use to turn their dreams into reality. Pennco Tech's career training schools in New Jersey and Pennsylvania employ instructors who know what it takes to achieve career goals; through hands-on and classroom training you will receive the necessary building blocks to succeed. Take a look at our programs and choose the right one that helps you achieve your dreams. Pennco Tech can help you bridge the gap between dreams and reality. We are a technical school with locations in Blackwood, New Jersey and Bristol, Pennsylvania and we work with you to formulate a solid plan, and then give you the training and employer connections you need to accomplish that plan.
School Highlights
Pennco Tech-Bristol serves 872 students (69% of students are full-time).
The college's student-teacher ratio of 15:1 is same as the state community college average of 15:1.
Minority enrollment is 56% of the student body (majority Black and Hispanic), which is more than the state average of 48%.
Quick Facts (2026)
- Enrollment: 872 students
- Acceptance Rate: 90%
- Student-teacher ratio: 15:1
- Minority enrollment: 56%
- Source: Integrated Postsecondary Education Data System (IPEDS)
Top Rankings
Pennco Tech-Bristol ranks among the top 20% of public schools in Pennsylvania for:
Category
Attribute
Diversity
Debt For Students
School Overview
The teacher population of 60 teachers has stayed relatively flat over five years.
Pennco Tech-Bristol
(PA) Community College Avg.
Carnegie Classification
Special Focus Two-Year: Technical Professions
Not applicable, not in Carnegie universe (not accredited or nondegree-granting)
Institution Level
At least 2 but less than 4 years
At least 2 but less than 4 years
Institution Control
Private for-profit
Private not-for-profit
Year Founded
1973
Total Faculty
60 staff
59 staff
Number of Programs Offered
13
29
Student Body
The student population of Pennco Tech-Bristol has grown by 70% over five years.
The student-teacher ratio of 15:1 has decreased from 17:1 over five years.
The Pennco Tech-Bristol diversity score of 0.70 is more than the state average of 0.68. The school's diversity has grown by 14% over five years.
Total Enrollment
872 students
461 students
Student-Teacher Ratio
15:1
15:1
# Full-Time Students
604 students
325 students
# Part-Time Students
268 students
136 students
# Enrollment Undergraduate
872 students
298 students
# Full-Time Undergraduate Students
604 students
326 students
# Full-Time Graduate Students
n/a
10 students
# Part-Time Undergraduate Students
268 students
151 students
# Part-Time Graduate Students
n/a
12 students
Total Dormitory Capacity
16 students
330 students
% Asian
2%
5%
% Hispanic
23%
11%
% Black
23%
15%
% White
44%
52%
% Hawaiian
5%
3%
% Two or more races
3%
3%
% Non Resident races
n/a
1%
% Unknown races
n/a
10%
Diversity Score
0.70
0.68
College Completion Rate (Students who graduate in less than 4 years)
73%
60%
College Completion Rate (Students who graduate in 4 years or more than 4 years)
n/a
36%
Average Graduate Earnings (10 Years)
$34,800
$34,900
Tuition and Acceptance Rate
% Students Receiving Some Financial Aid
72%
88%
Median Debt for Graduates
$7,667
$13,000
Median Debt for Dropouts
$4,639
$6,260
Acceptance Rate
90%
74%
SAT Reading
n/a
460
SAT Math
n/a
470
SAT Writing
n/a
435
ACT Composite
n/a
20
ACT English
n/a
20
ACT Math
n/a
21
ACT Writing
n/a
7
Source: 2024 (or latest year available) Integrated Postsecondary Education Data System (IPEDS)
School Notes
- 1961, the School of Electronics was founded in Philadelphia by the Philco Corporation. In 1966 the Ford Motor Company, through its subsidiary, Philco-Ford, established the School of Automotive Technology, also in Philadelphia. In 1973, these two schools were acquired by Pennco Insitutes, Inc., a Pennsylvania corporation. 1975, the School of Electronics and the School of Automotive Technology moved to Bristol, Pennsylvania, and consolidated as Pennco Tech. In 1978, a School of Automotive Body Repair was established in Bristol and an additional Pennco Tech facility was opened in Pennsauken, New Jersey, consisting of a School of Automotive Technology and a School of Automotive Body Repair. The college offers programs in A+/Network+ Technology, AirConditioning/Refrigeration/Heating, Automotive Technology, Auto Body Technology, Diesel Automotive Technology, Drafting/CAD, Electrician, Marine Technology, Medical Assistant-Administrative and Pharmacy Assistant. Pennco Tech can help you get the spark you need. Our programs are designed to be completed in a short amount of time allowing our graduates to enter their career field sooner while at the same time increasing their experience. Hands on instruction allows the graduate the ability to take what they've learned in the classroom and shops today and apply it on the job tomorrow. Pennco Tech is accredited by the Accrediting Commission of Career Schools and Colleges of Technology (ACCSCT).
Frequently Asked Questions
What is the acceptance rate of Pennco Tech-Bristol?
The acceptance rate of Pennco Tech-Bristol is 90%, which is higher than the state average of 74%.
What is Pennco Tech-Bristol's ranking?
Pennco Tech-Bristol ranks among the top 20% of community college in Pennsylvania for: Diversity in US community colleges and Least debt for graduating students.
Recent Articles

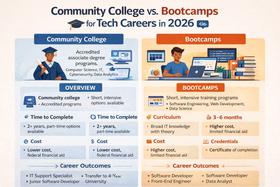
Community College vs. Bootcamps for Tech Careers in 2026
Community college vs. bootcamps in 2026. Compare cost, outcomes, credentials, and hiring trends to choose the best tech career path.

How to Build a Class Schedule That Fits Your Life (Spring 2026)
Learn how to build a class schedule that fits your life with expert tips, updated strategies for Spring 2026, and practical planning tools for students and families.

Top 10 Jobs for Community College Graduates in 2026
Meta Description: Discover high-demand jobs for community college graduates, with current salary trends, costs, and career pathways.


