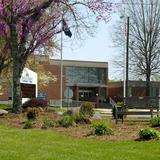
School Highlights
Sovah School of Health Professions serves 19 students (100% of students are full-time).
Minority enrollment is 97% of the student body (majority Asian), which is more than the state average of 53%.
Quick Facts (2026)
- Enrollment: 19 students
- Minority enrollment: 97%
- Source: Integrated Postsecondary Education Data System (IPEDS)
Top Rankings
Sovah School of Health Professions ranks among the top 20% of public schools in Virginia for:
Category
Attribute
School Overview
Sovah School of Health Professions
(VA) Community College Avg.
Carnegie Classification
Not applicable, not in Carnegie universe (not accredited or nondegree-granting)
Associate's Colleges: Mixed Transfer/Career & Technical-Mixed Traditional/Nontraditional
Institution Level
Less than 2 yrs
At least 2 but less than 4 years
Institution Control
Public
Public
Total Faculty
n/a
129 staff
School Calendar
Student Body
The student population of Sovah School of Health Professions has declined by 83% over five years.
The Sovah School of Health Professions diversity score of 0.30 is less than the state average of 0.71. The school's diversity has grown by 19% over five years.
Total Enrollment
19 students
1,608 students
Student-Teacher Ratio
n/a
23:1
# Full-Time Students
19 students
637 students
# Part-Time Students
n/a
971 students
# Enrollment Undergraduate
n/a
314 students
# Full-Time Undergraduate Students
19 students
611 students
# Full-Time Graduate Students
n/a
158 students
# Part-Time Undergraduate Students
n/a
971 students
# Part-Time Graduate Students
n/a
61 students
Total Dormitory Capacity
n/a
476 students
% American Indian/Alaskan
n/a
n/a
% Asian
8%
8%
% Hispanic
n/a
13%
% Black
3%
21%
% White
3%
47%
% Hawaiian
83%
n/a
% Two or more races
3%
5%
% Non Resident races
n/a
2%
% Unknown races
n/a
4%
Diversity Score
0.30
0.71
College Completion Rate (Students who graduate in less than 4 years)
n/a
41%
College Completion Rate (Students who graduate in 4 years or more than 4 years)
n/a
26%
Average Graduate Earnings (10 Years)
$55,600
$29,600
Tuition and Acceptance Rate
% Students Receiving Some Financial Aid
68%
75%
Median Debt for Graduates
$12,667
$9,750
Median Debt for Dropouts (Year 2008)
$4,062
$3,313
Acceptance Rate
n/a
59%
Source: 2024 (or latest year available) Integrated Postsecondary Education Data System (IPEDS)
Frequently Asked Questions
What is Sovah School of Health Professions's ranking?
Sovah School of Health Professions ranks among the top 20% of community college in Virginia for: Average community college minority breakdown.
Recent Articles

Most In-Demand Community College Majors for 2025–26
Explore the most in-demand community college majors for 2025–26 workforce needs, aligned with hiring trends, wages, and transfer pathways.

New Guidebook Helps Students Navigate Community College
A new guidebook offers practical strategies to help students and families succeed in community college, from admissions to transfer and career planning.

Work-Study Opportunities for Spring 2026 Guide
Learn how to secure work-study opportunities for Spring 2026 before classes start, including timelines, tips, and eligibility guidance.


