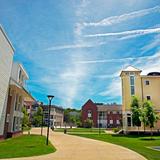
- For over 41 years, Quinsigamond Community College in Worcester, MA has provided thousands of men and women opportunities for a first-rate education and personal growth, whether preparing them for immediate entry into the workforce, transfer to bachelor level programs in four-year colleges and universities, or for personal and cultural enrichment. Area and regional businesses and professionals such as Intel Corporation, Verizon, Kennedy Diecasting, Waters Corporation, UPS, Ken-Weld, and Saint Gobain have benefited as well through regular and customized workforce training and education programming designed in partnership. In addition, the College works directly with K-12 school systems in a variety of collaborations and partnerships.
School Highlights
Quinsigamond Community College serves 8,733 students (28% of students are full-time).
The college's student-teacher ratio of 13:1 is higher than the state community college average of 12:1.
Minority enrollment is 54% of the student body (majority Hispanic), which is less than the state average of 57%.
Quick Facts (2026)
- Enrollment: 8,733 students
- In-state tuition: $5,094
- Out-state tuition: $10,038
- Acceptance Rate: 100%
- Student-teacher ratio: 13:1
- Minority enrollment: 54%
- Source: Integrated Postsecondary Education Data System (IPEDS)
Top Rankings
Quinsigamond Community College ranks among the top 20% of public schools in Massachusetts for:
Category
Attribute
Community Size
School Overview
The teacher population of 669 teachers has stayed relatively flat over five years.
Quinsigamond Community College
(MA) Community College Avg.
Carnegie Classification
Associate's Colleges: Mixed Transfer/Career & Technical-High Traditional
Associate's Colleges: Mixed Transfer/Career & Technical-Mixed Traditional/Nontraditional
Institution Level
Less than 2 yrs
At least 2 but less than 4 years
Institution Control
Public
Public
Total Faculty
669 staff
290 staff
School Calendar
Student Body
The student population of Quinsigamond Community College has grown by 25% over five years.
The student-teacher ratio of 13:1 has decreased from 31:1 over five years.
The Quinsigamond Community College diversity score of 0.71 is less than the state average of 0.74. The school's diversity has grown by 14% over five years.
Total Enrollment
8,733 students
2,687 students
Student-Teacher Ratio
13:1
12:1
# Full-Time Students
2,431 students
1,039 students
# Part-Time Students
6,302 students
1,648 students
# Enrollment Undergraduate
873 students
278 students
# Full-Time Undergraduate Students
2,431 students
839 students
# Full-Time Graduate Students
n/a
217 students
# Part-Time Undergraduate Students
n/a
1,619 students
# Part-Time Graduate Students
n/a
346 students
Total Dormitory Capacity
n/a
400 students
% American Indian/Alaskan
n/a
n/a
% Asian
6%
6%
% Hispanic
22%
21%
% Black
15%
15%
% White
46%
43%
% Hawaiian
n/a
1%
% Two or more races
3%
3%
% Non Resident races
n/a
2%
% Unknown races
7%
9%
Diversity Score
0.71
0.74
College Completion Rate (Students who graduate in less than 4 years)
21%
21%
College Completion Rate (Students who graduate in 4 years or more than 4 years)
n/a
45%
Average Graduate Earnings (10 Years)
$37,400
$35,500
Tuition and Acceptance Rate
The public in-state tuition of $5,094 is more than the state average of $4,424. The in-state tuition has declined by 12% over four years.
The public out-state tuition of $10,038 is more than the state average of $9,401. The out-state tuition has declined by 6% over four years.
In-State Tuition Fees
$5,094
$4,424
Out-State Tuition Fees
$10,038
$9,401
% Students Receiving Some Financial Aid
83%
87%
Median Debt for Graduates
$15,406
$11,249
Median Debt for Dropouts
$8,189
$5,500
Acceptance Rate
100%
75%
SAT Reading
n/a
540
SAT Math
n/a
535
SAT Writing
n/a
480
ACT Composite
n/a
21
Source: 2024 (or latest year available) Integrated Postsecondary Education Data System (IPEDS)
School Notes
- QCC was established in 1963 to provide access to higher education to residents of Central Massachusetts. Since the early 60s, enrollment has grown from 300 to over 13,000 full and part-time day and evening students served. Over 70 associate degree and certificate career options in Business, Health Care, Technology, Liberal Arts, and Human Services. The College also offers a wide variety of non-credit courses, workshops, and seminars through its Division of Continuing Education at its downtown College at CitySquare campus. In addition, over 300 noncredit and nearly 35 credit courses are offered online. The College also has program locations at the Senior Center in Worcester (Hotel/Rest. Mgt.), Blackstone Valley Reg. Technical High School in Upton (Automotive Technology), and Southbridge High School, Southbridge (evening classes offerings). At Quinsigamond Community College, students are our first priority. We are here to support you throughout your educational career; we want to help you become successful in the professional career of your choice. We strive to improve our service delivery -- with upgraded technology, specialized learning centers and dedicated faculty and staff -- all on hand to deliver the best instruction and support to you! The College is accredited by the New England Association of Schools and Colleges (NEASC). Membership in the Association indicates that an institution has been stringently evaluated and found to meet high standards agreed upon by qualified educators.
Frequently Asked Questions
How much does Quinsigamond Community College cost?
Quinsigamond Community College's tuition is approximately $5,094 for In-State students and $10,038 for Out-State students.
What is the acceptance rate of Quinsigamond Community College?
The acceptance rate of Quinsigamond Community College is 100%, which is higher than the state average of 75%.
What is Quinsigamond Community College's ranking?
Quinsigamond Community College ranks among the top 20% of community college in Massachusetts for: Largest student body.
In what neighborhood is Quinsigamond Community College located?
Quinsigamond Community College is located in the Greendale neighborhood of Worcester, MA.
Recent Articles

Giving Back: How to Choose the Right Community College for Nursing, IT, or Business in 2026
Practical guidance for selecting the best community college for Nursing, IT, or Business in 2026, with expert tips on fit, outcomes, and career alignment.

How Community College Students Can Build a Transfer-Ready Portfolio for 2026
Learn how community college students can build a transfer-ready portfolio for 2026 admissions with coursework, projects, recommendations, and planning tips.

Community Colleges on the President’s Honor Roll for Service
How community colleges earn the President’s Honor Roll for Community Service, with 2026 examples, impact data, and student opportunities.


