


- Over 35,000 students have enrolled at Marion Technical College for some type of training since 1971. MTC's student body is a melting pot of sixteen-year-olds through sixty-year-olds. 'We are proud to have a diverse student body where the strengths of each student enhances the learning environment for all students. Our students 'do it all' ' juggling families, jobs, and college ' and they are able to do it because of MTC's flexibility with classes offered throughout the day and evening, one night per week, on weekends, and online.
School Highlights
Marion Technical College serves 3,346 students (15% of students are full-time).
The college's student-teacher ratio of 36:1 is higher than the state community college average of 31:1.
Minority enrollment is 24% of the student body (majority Black), which is less than the state average of 38%.
Quick Facts (2026)
- Enrollment: 3,346 students
- In-state tuition: $4,414
- Out-state tuition: $6,334
- Acceptance Rate: 100%
- Student-teacher ratio: 36:1
- Minority enrollment: 24%
- Source: Integrated Postsecondary Education Data System (IPEDS)
Top Rankings
Marion Technical College ranks among the top 20% of public schools in Ohio for:
Category
Attribute
Affordability
Community Size
Debt For Students
School Overview
The teacher population of 92 teachers has declined by 41% over five years.
Marion Technical College
(OH) Community College Avg.
Carnegie Classification
Associate's Colleges
Baccalaureate/Associate's Colleges
Institution Level
Four or more years
Four or more years
Institution Control
Public
Private not-for-profit
Colors
Blue and White
Total Faculty
92 staff
24 staff
School Calendar
Student Body
The student population of Marion Technical College has grown by 55% over five years.
The student-teacher ratio of 36:1 has increased from 16:1 over five years.
The Marion Technical College diversity score of 0.41 is more than the state average of 0.00. The school's diversity has grown by 98% over five years.
Total Enrollment
3,346 students
565 students
Student-Teacher Ratio
36:1
31:1
# Full-Time Students
518 students
342 students
# Part-Time Students
2,828 students
270 students
# Enrollment Undergraduate
3,346 students
565 students
# Full-Time Undergraduate Students
518 students
342 students
# Part-Time Undergraduate Students
2,828 students
356 students
% Asian
2%
3%
% Hispanic
2%
6%
% Black
10%
16%
% White
76%
62%
% Two or more races
6%
4%
% Unknown races
4%
8%
Diversity Score
0.41
0.00
College Completion Rate (Students who graduate in less than 4 years)
30%
59%
Average Graduate Earnings (10 Years)
$31,600
$31,900
Tuition and Acceptance Rate
The public in-state tuition of $4,414 is less than the state average of $5,419. The in-state tuition has declined by 21% over four years.
The public out-state tuition of $6,334 is less than the state average of $10,873. The out-state tuition has declined by 33% over four years.
In-State Tuition Fees
$4,414
$5,419
Out-State Tuition Fees
$6,334
$10,873
Tuition Notes
some additional lab
% Students Receiving Some Financial Aid
87%
91%
Median Debt for Graduates
$8,750
$18,562
Median Debt for Dropouts
$5,000
$6,516
Acceptance Rate
100%
75%
Source: 2025 (or latest year available) Integrated Postsecondary Education Data System (IPEDS) , School Administrators
School Notes
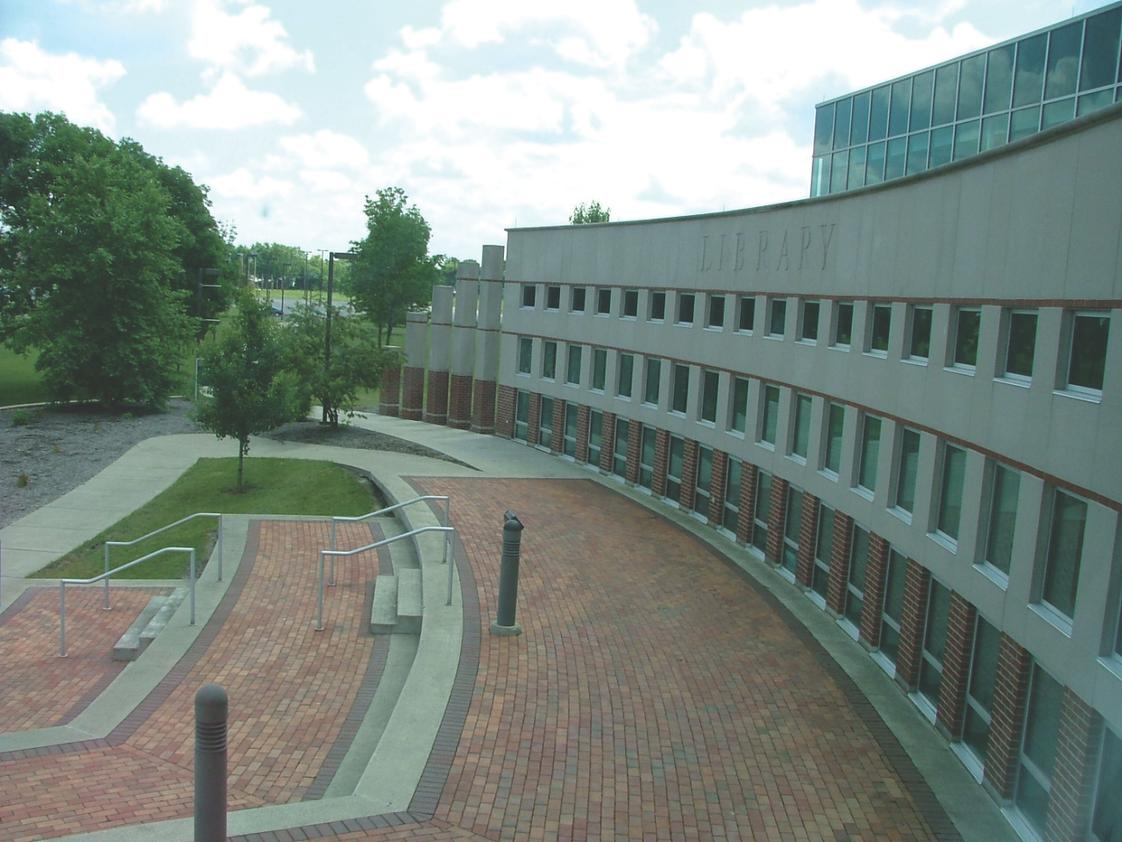
- In 1971, Marion Technical College [MTC] began a history of service, opening its doors to 187 students enrolled in four technical programs. To date, 33,383 have attended classes in more than 40 associate degree and certificate programs in Business, Engineering, Health, Information, Medical Sciences, and Public Service technologies. Marion Technical College is located on a 180-acre campus just east of the city of Marion on State Route 95, sharing five buildings with The Ohio State University at Marion [OSUM]. The Marion Campus is a co-located campus, hosting Marion Technical College and The Ohio State University at Marion [OSUM]. The Technical Education Center houses most MTC classes, state-of-the-art labs, and administrative offices. Morrill Hall features labs, an auditorium, art gallery, and classrooms. The George H. Alber Student Center houses the Marion Campus Bookstore, gymnasium and locker rooms, weight room, student government offices, game room, lounge, vending area, and classrooms. The Library/Classroom Building houses campus library services, classrooms, meeting rooms, study areas, and microcomputer labs. The Center for Workforce Development, a 10,000 square foot facility located adjacent to the Campus, focuses on specialized training for area business and industry. Marion Technical College is accredited by The Higher Learning Commission and a member of the North Central Association. MTC offers the Associate of Arts and Associate of Science transfer degrees creating easy opportunity to begin a bachelor's degree.
Frequently Asked Questions
How much does Marion Technical College cost?
Marion Technical College's tuition is approximately $4,414 for In-State students and $6,334 for Out-State students.
What is the acceptance rate of Marion Technical College?
The acceptance rate of Marion Technical College is 100%, which is higher than the state average of 75%.
What is Marion Technical College's ranking?
Marion Technical College ranks among the top 20% of community college in Ohio for: Least expensive tuition, Largest student body and Least debt for graduating students.
Recent Articles

Workforce Pell Is Coming: Should You Wait to Enroll?
Workforce Pell Grants launch in July 2026. Learn who benefits, which programs qualify, and whether delaying enrollment makes financial sense.

The “Total Commute Cost” Test for Choosing a Community College
Tuition is only part of the equation. Learn how to calculate the total commute cost when comparing community colleges and making enrollment decisions.

How to Tell Whether a Short-Term Certificate Is Worth Federal Aid
Not all short-term certificates offer the same value. Learn how to evaluate career outcomes, ROI, and employer demand before using federal aid.


")