- Mission of Las Vegas College is to provide men and women of all ages with the practical skills, education and training needed to excel in their chosen fields. The college thus provides an invaluable and timely service to society by preparing candidates to meet and exceed existing needs in the employment arena. We are totally committed to this objective and to the success of our students.
School Highlights
Las Vegas College serves 536 students (100% of students are full-time).
The college's student-teacher ratio of 17:1 is lower than the state community college average of 31:1.
Minority enrollment is 82% of the student body (majority Hispanic and Black), which is more than the state average of 66%.
Quick Facts (2026)
- Enrollment: 536 students
- Private-state tuition: $15,000
- Acceptance Rate: 54%
- Student-teacher ratio: 17:1
- Minority enrollment: 82%
- Source: Verified school update
Top Rankings
Las Vegas College ranks among the top 20% of public schools in Nevada for:
Category
Attribute
Diversity
School Resources
Completion Rates
Debt For Students
School Overview
The teacher population of 32 teachers has grown by 68% over five years.
Las Vegas College
(NV) Community College Avg.
Carnegie Classification
Associate's Colleges
Associate's Colleges: High Career & Technical-Mixed Traditional/Nontraditional
Institution Level
Four or more years
At least 2 but less than 4 years
Institution Control
Private for-profit
Private for-profit
Total Faculty
32 staff
36 staff
Student Body
The student population of Las Vegas College has grown by 34% over five years.
The student-teacher ratio of 17:1 has increased from 9:1 over five years.
The Las Vegas College diversity score of 0.80 is more than the state average of 0.00. The school's diversity has grown by 9% over five years.
Total Enrollment
536 students
587 students
Student-Teacher Ratio
17:1
31:1
# Full-Time Students
536 students
587 students
# Part-Time Students
48 students
2,638 students
# Enrollment Undergraduate
536 students
587 students
# Full-Time Undergraduate Students
536 students
587 students
% Asian
18%
8%
% Hispanic
26%
35%
% Black
23%
10%
% White
18%
34%
% Hawaiian
3%
1%
% Two or more races
3%
7%
% Unknown races
9%
3%
Diversity Score
0.80
0.00
College Completion Rate (Students who graduate in less than 4 years)
58%
54%
College Completion Rate (Students who graduate in 4 years or more than 4 years)
65%
34%
Average Graduate Earnings (10 Years)
$26,500
$32,800
Tuition and Acceptance Rate
The private state tuition of $15,000 is more than the state average of $14,315. The private state tuition has stayed relatively flat over four years.
Private State Tuition Fees
$15,000
$14,315
% Students Receiving Some Financial Aid
97%
89%
Median Debt for Graduates
$8,444
$9,631
Median Debt for Dropouts
$3,906
$5,125
Acceptance Rate
54%
54%
Source: 2025 (or latest year available) Integrated Postsecondary Education Data System (IPEDS) , School Administrators
School Notes
- Las Vegas College was founded by Betty Krolak in 1979 under the name Krolak Business Institute. Barbara A. and E. T. Paulus purchased the Institute in December of 1980 and incorporated it under the name of TO-Ba Corporation. The Institute was granted a license to award Associate degrees on January 7, 1986, and the Institute�s name was changed to Las Vegas Business College. The college was acquired by Rhodes Colleges, Inc. on October 17, 1996. At that time, the name of the institution was changed to Las Vegas College. To better accomodate the needs of the students and community, Las Vegas College added the Henderson, NV campus in addition to its Las Vegas location. In 2005, the Las Vegas Campus merged with the Henderson campus. Our programs emphasize real-world training that is tailored to meet the needs of potential employers. The fields of study focus on industries that offer solid, long-term career opportunities for graduates. Here at our campus, we maintain a well-defined program philosophy of providing a quality education that emphasizes practical skills; employ a highly skilled and dedicated faculty; and cater to students seeking a strong knowledge base and the experience needed to succeed in their chosen fields. Las Vegas College is accredited by the Accrediting Council for Independent Colleges and Schools to award occupational associate's degrees and diplomas.
Frequently Asked Questions
How much does Las Vegas College cost?
Las Vegas College's private state tuition is approximately $15,000.
What schools are Las Vegas College often compared to?
Las Vegas Collegeis often viewed alongside schools like College of Southern Nevada by visitors of our site.
What is the acceptance rate of Las Vegas College?
The acceptance rate of Las Vegas College is 54%, which is equal to the state average of 54%.
What is Las Vegas College's ranking?
Las Vegas College ranks among the top 20% of community college in Nevada for: Diversity in US community colleges, Percent of students receiving financial aid, Highest completion rates and Least debt for graduating students.
In what neighborhood is Las Vegas College located?
Las Vegas College is located in the Gibson Springs neighborhood of Las Vegas, NV.
Recent Articles

Workforce Pell Is Coming: Should You Wait to Enroll?
Workforce Pell Grants launch in July 2026. Learn who benefits, which programs qualify, and whether delaying enrollment makes financial sense.

The “Total Commute Cost” Test for Choosing a Community College
Tuition is only part of the equation. Learn how to calculate the total commute cost when comparing community colleges and making enrollment decisions.

How to Tell Whether a Short-Term Certificate Is Worth Federal Aid
Not all short-term certificates offer the same value. Learn how to evaluate career outcomes, ROI, and employer demand before using federal aid.
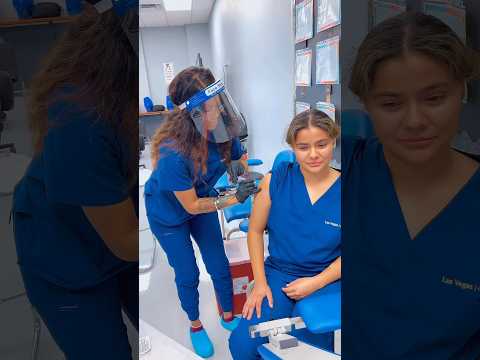
 students celebrate a huge milestone at Las Vegas College’s 2025 Pinning Ceremony! 🎉 From hard work in the classroom to hands-on training in labs, our future nurses are ready to make a difference in healthcare.
Join us in honoring their journey as they receive their nursing pins, a symbol of dedication, compassion, and commitment to patient care. 👏💙
🎥 Thinking about a career in nursing? Learn more about our LPN program and how you can start your path in healthcare today! Click the link below to explore your future.
🔗 Learn More: lvcollege.edu
📌 Don't forget to like, comment, and subscribe for more nursing student success stories! 🩺👩⚕️👨⚕️")