University of Antelope Valley

44055 Sierra Highway
Lancaster, CA 93534
Top Ranked (2025): View Rankings
  • The University of Antelope Valley was a private, for-profit university in Lancaster, California. It offered master's, bachelor's, and associate degrees as well as certificate programs and continuing education courses.

School Highlights

University of Antelope Valley serves 578 students (93% of students are full-time).
The college's student:teacher ratio of 4:1 is lower than the state community college average of 32:1.
Minority enrollment is 95% of the student body (majority Black), which is more than the state average of 77%.

Quick Stats (2025)

  • Enrollment: 578 students
  • Acceptance Rate: 77%
  • Student:teacher ratio: 4:1
  • Minority enrollment: 95%
  • Source: Integrated Postsecondary Education Data System (IPEDS)

Top Rankings

University of Antelope Valley ranks among the top 20% of public schools in California for:

School Overview

The teacher population of 137 teachers has stayed relatively flat over five years.
University of Antelope Valley
(CA) Community College Avg.
Carnegie Classification
Not applicable, not in Carnegie universe (not accredited or nondegree-granting)
Baccalaureate/Associate's Colleges: Associate's Dominant
Institution Level
Four or more years
At least 2 but less than 4 years
Institution Control
Private for-profit
Public
Total Faculty
137 staff
315 staff
This chart displays total faculty of University of Antelope Valley and community college average number of faculty in California by year, with the latest 2022-23 school year data.
Number of Programs Offered
30
12
School Calendar

Student Body

The student population of University of Antelope Valley has declined by 28% over five years.
The student:teacher ratio of 4:1 has decreased from 5:1 over five years.
The University of Antelope Valley diversity score of 0.73 is more than the state average of 0.70. The school's diversity has stayed relatively flat over five years.
Total Enrollment
578 students
9,796 students
This chart displays the total enrollment of University of Antelope Valley and community college average number of enrollment of California by year, with the latest 2022-23 school year data.
Student : Teacher Ratio
4:1
32:1
This chart displays the student staff ratio of University of Antelope Valley and community college average student staff ratio of California by year, with the latest 2022-23 school year data.
# Full-Time Students
539 students
1,259 students
This chart displays the total number of Full-time students enrollment of University of Antelope Valley and average number of community college Full-time students enrollment of California by year, with the latest 2022-23 school year data.
# Part-Time Students
39 students
8,537 students
This chart displays the total number of Part-time students enrollment of University of Antelope Valley and average number of community college Part-time students enrollment of California by year, with the latest 2022-23 school year data.
This chart displays the Full-time students and Part-time students enrollment breakdown of University of Antelope Valley.
This chart displays community college average Full-Time students and Part-Time students enrollment breakdown of California.
# Enrollment Undergraduate
622 students
242 students
# Full-Time Undergraduate Students
516 students
1,250 students
This chart displays the total number of Full-time undergraduate students enrollment of University of Antelope Valley and average number of community college Full-time undergraduate  students enrollment of California by year, with the latest 2022-23 school year data.
# Full-Time Graduate Students
23 students
63 students
This chart displays the total number of Full-time graduate students enrollment of University of Antelope Valley and average number of community college Full-time graduate students enrollment of California by year, with the latest 2022-23 school year data.
This chart displays graduation rate breakdown of University of Antelope Valley
California All Graduation Breakdown
# Part-Time Undergraduate Students
34 students
8,299 students
# Part-Time Graduate Students
5 students
10 students
This chart displays graduation rate breakdown of University of Antelope Valley
California All Part Time Graduation Breakdown
Total Dormitory Capacity
85 students
121 students
This chart displays the dormitory capacity of University of Antelope Valley and the community college average dormitory capacity of California by year, with the latest 2022-23 school year data.
% American Indian/Alaskan
2%
n/a
This chart displays the percentage of American Indian/Alaskan students in University of Antelope Valley and the percentage of American Indian/Alaskan community college students in California by year, with the latest 2022-23 school year data.
% Asian
19%
13%
This chart displays the percentage of Asian students in University of Antelope Valley and the percentage of Asian community college students in California by year, with the latest 2022-23 school year data.
% Hispanic
1%
47%
This chart displays the percentage of Hispanic students in University of Antelope Valley and the percentage of Hispanic community college students in California by year, with the latest 2022-23 school year data.
% Black
44%
7%
This chart displays the percentage of Black students in University of Antelope Valley and the percentage of Black community college students in California by year, with the latest 2022-23 school year data.
% White
5%
23%
This chart displays the percentage of White students in University of Antelope Valley and the percentage of White community college students in California by year, with the latest 2022-23 school year data.
% Hawaiian
14%
1%
This chart displays the percentage of Hawaiian students in University of Antelope Valley and the percentage of Hawaiian community college students in California by year, with the latest 2022-23 school year data.
% Two or more races
12%
5%
This chart displays the percentage of Two or more races students in University of Antelope Valley and the percentage of Two or more races community college students in California by year, with the latest 2022-23 school year data.
% Non Resident races
n/a
1%
This chart displays the percentage of Non Resident students in University of Antelope Valley and the percentage of Non Resident community college students in California by year, with the latest 2020-21 school year data.
% Unknown races
3%
3%
This chart displays the percentage breakdown of students of all ethnic groups in University of Antelope Valley.
This chart displays the percentage breakdown of students of all ethnic groups in California.
Diversity Score
0.73
0.70
This chart displays the diversity score of University of Antelope Valley and the community college average diversity score of California by year, with the latest 2022-23 school year data.
College Completion Rate (Students who graduate in less than 4 years)
98%
26%
This chart displays completion rates for First-Time of Full-time students of University of Antelope Valley and community college average completion rates for First-Time of Full-time students of California by year, with the latest 2007-08 school year data.
College Completion Rate (Students who graduate in 4 years or more than 4 years)
0.7315%
0.4286%
Average Graduate Earnings (10 Years) (Year 2013)
$27,800
$34,700

Tuition and Acceptance Rate

% Students Receiving Some Financial Aid
37%
85%
This chart displays the percent of students who is receiving some financial aid in University of Antelope Valley and the percent of community college students who is receiving some financial aid in California by year, with the latest 2022-23 school year data.
Median Debt for Graduates
$13,388
$10,500
This chart displays median debt for students who have completed a certificate or degree in University of Antelope Valley and average median debt for community college students who have completed a certificate or degree in California by year, with the latest 2022-23 school year data.
Median Debt for Dropouts
$5,250
$6,239
This chart displays median debt for students who have not completed a certificate or degree in University of Antelope Valley and average median debt for community college students who have not completed a certificate or degree in California by year, with the latest 2022-23 school year data.
Acceptance Rate
77%
94%
This chart displays the percent admitted of University of Antelope Valley and the community college average percent admitted of California by year, with the latest 2007-08 school year data.
Source: 2023 (or latest year available) Integrated Postsecondary Education Data System (IPEDS)

Frequently Asked Questions

What is the acceptance rate of University of Antelope Valley?
The acceptance rate of University of Antelope Valley is 77%, which is lower than the state average of 94%.
What is University of Antelope Valley's ranking?
University of Antelope Valley ranks among the top 20% of community college in California for: Average community college minority breakdown and Most Programs Offered.

Recent Articles

Is Contraception the Answer for College Completion Rates?
This article discusses the "Make it Personal: College Completion" campaign launched by the American Association of Community Colleges. The initiative aims to reduce unplanned pregnancies among community college students to improve completion rates. It explores the campaign's approaches, including curriculum integration and student services, and presents statistics on the impact of unplanned pregnancies on college success.
How a Community College Apprenticeship Improves Your Resume
Learn about the benefits of an apprenticeship during your time at community college and how it can benefit your resume and future career.
Careers: Customs Broker/Freight Forwarder/Logistics
Explore the dynamic world of customs brokerage and freight forwarding, where precision meets strategy in global logistics. This article delves into the critical role of customs brokers and freight forwarders, who navigate complex regulations and ensure the smooth transit of goods across international borders. Discover the skills and expertise required to excel in this field, from understanding tariff codes to managing documentation and customs clearance. Learn about the impact of these professionals on supply chain efficiency and the opportunities available in this growing industry.

Quick Stats (2025)

  • Enrollment: 578 students
  • Acceptance Rate: 77%
  • Student:teacher ratio: 4:1
  • Minority enrollment: 95%
  • Source: Integrated Postsecondary Education Data System (IPEDS)

Related School Videos

Did You Know?

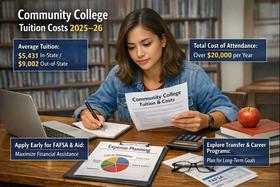
For Los Angeles County, CA public community colleges, the average tuition is approximately $2,637 per year for in-state students and $7,755 for out-of-state students. For private community colleges, the average yearly tuition is approximately $21,295 per year. Read more about average community college tuition costs across the country.

The average community college acceptance rate in Los Angeles County, CA is 77%. Read more about national community college acceptance rates.

Los Angeles County, CA community colleges have a diversity score of 0.61, which is lower than the national average of 0.74. The most diverse community college in Los Angeles County, CA is Keck Graduate Institute. Read more about community college diversity statistics in the USA.

Quick Links