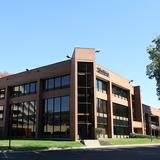
Sanford-Brown College-Tysons Corner (Closed 2015)

1761 Old Meadow Road
Mc Lean, VA 22102
  • At Sanford-Brown College-Vienna, our mission is to offer career-focused programs that have been designed to prepare you with the knowledge, skills and confidence to pursue a satisfying future in your area of interest. Our faculty and staff are devoted to helping you achieve your personal and professional goals. SBC-Vienna's instructors are selected, not only for their academic credentials but also for their commitment to the educational success of each student who comes through our doors. Committed to diversity in our student body, faculty, and administrative staff, SBC-Vienna provides a rich environment for study that reflects the global reality in which we all live, work, and play. Day, evening and online schedules are available, as are opportunities to participate in Career Clubs, the Honor Society, internships in your professional field and community service.

School Highlights

Sanford-Brown College-Tysons Corner served 29 students (97% of students were full-time).
The college's student:teacher ratio of 7:1 was lower than the state community college average of 17:1.
Minority enrollment was 99% of the student body (majority Black), which was more than the state average of 48%.

School Overview

Sanford-Brown College-Tysons Corner
(VA) Community College Avg.
Carnegie Classification
Item not available
Associates Colleges
Institution Level
Four or more years
At least 2 but less than 4 years
Institution Control
Private, for profit
Public
Total Faculty
4 staff
129 staff
This chart display total faculty of Sanford-Brown College-Tysons Corner and community college average number of faculty in VA by year, with the latest 2014-15 school year data.

Student Body

Total Enrollment
29 students
2,063 students
This chart display the total enrollment of Sanford-Brown College-Tysons Corner and community college average number of enrollment of VA by year, with the latest 2014-15 school year data.
Student : Teacher Ratio
7:1
17:1
This chart display the student staff ratio of Sanford-Brown College-Tysons Corner and community college average student staff ratio of VA by year, with the latest 2014-15 school year data.
# Full-Time Students
28 students
843 students
This chart display the total number of Full-time students enrollment of Sanford-Brown College-Tysons Corner and average number of community college Full-time students enrollment of VA by year, with the latest 2014-15 school year data.
# Part-Time Students
1 students
1,220 students
This chart display the total number of Part-time students enrollment of Sanford-Brown College-Tysons Corner and average number of community college Part-time students enrollment of VA by year, with the latest 2014-15 school year data.
This chart display the Full-time students and Part-time students enrollment breakdown of Sanford-Brown College-Tysons Corner.
This chart display community college average Full-Time students and Part-Time students enrollment breakdown of VA.
# Enrollment Undergraduate
168 students
232 students
# Full-Time Undergraduate Students
28 students
802 students
This chart display the total number of Full-time undergraduate students enrollment of Sanford-Brown College-Tysons Corner and average number of community college Full-time undergraduate  students enrollment of VA by year, with the latest 2014-15 school year data.
# Full-Time Graduate Students
n/a
101 students
# Part-Time Undergraduate Students
1 students
1,243 students
# Part-Time Graduate Students
n/a
20 students
Total Dormitory Capacity
n/a
476 students
% American Indian/Alaskan
1%
n/a
% Asian
1%
7%
This chart display the percentage of Asian students in Sanford-Brown College-Tysons Corner and the percentage of Asian community college students in VA by year, with the latest 2014-15 school year data.
% Hispanic
4%
12%
This chart display the percentage of Hispanic students in Sanford-Brown College-Tysons Corner and the percentage of Hispanic community college students in VA by year, with the latest 2014-15 school year data.
% Black
21%
20%
This chart display the percentage of Black students in Sanford-Brown College-Tysons Corner and the percentage of Black community college students in VA by year, with the latest 2014-15 school year data.
% White
1%
52%
This chart display the percentage of White students in Sanford-Brown College-Tysons Corner and the percentage of White community college students in VA by year, with the latest 2014-15 school year data.
% Two or more races
1%
4%
This chart display the percentage of Two or more races students in Sanford-Brown College-Tysons Corner and the percentage of Two or more races community college students in VA by year, with the latest 2014-15 school year data.
% Non Resident races
n/a
2%
% Unknown races
71%
3%
This chart display the percentage breakdown of students of all ethnic groups in Sanford-Brown College-Tysons Corner.
This chart display the percentage breakdown of students of all ethnic groups in VA.
Diversity Score
0.45
0.67
This chart display the diversity score of Sanford-Brown College-Tysons Corner and the community college average diversity score of VA by year, with the latest 2014-15 school year data.
College Completion Rate (Students who graduate in less than 4 years)
n/a
38%
College Completion Rate (Students who graduate in 4 years or more than 4 years)
n/a
0.39%
Average Graduate Earnings (10 Years)
$33,200
$29,600
This chart display average graduate earnings (10 Years) of Sanford-Brown College-Tysons Corner and community college average graduate earnings (10 Years) of VA by year, disaggregated by student subgroups with the latest 2012-13 school year data.

Tuition and Acceptance Rate

% Students Receiving Some Financial Aid
98%
86%
This chart display the percent of students who is receiving some financial aid in Sanford-Brown College-Tysons Corner and the percent of community college students who is receiving some financial aid in VA by year, with the latest 2012-13 school year data.
Median Debt for Graduates
$26,581
$10,869
This chart display median debt for students who have completed a certificate or degree in Sanford-Brown College-Tysons Corner and average median debt for community college students who have completed a certificate or degree in VA by year, with the latest 2014-15 school year data.
Median Debt for Dropouts
$21,193
$5,500
This chart display median debt for students who have not completed a certificate or degree in Sanford-Brown College-Tysons Corner and average median debt for community college students who have not completed a certificate or degree in VA by year, with the latest 2014-15 school year data.
Acceptance Rate
n/a
71%
Source: 2015 (or latest year available) Integrated Postsecondary Education Data System (IPEDS)

Recent Articles

Healthcare Careers Hub
Discover the opportunities in the healthcare field. Your community college offers the courses and training you need to fill a job in this field that always seems to have openings.
The Pros and Cons of On-Campus Housing for Community College
Can you really have an authentic college experience while living off-campus? This article explores the pros and cons of campus housing for community college students.
Community Colleges: A to Z
February 21, 2024
Community Colleges: A to Z
Explore the diverse landscape of community colleges with our comprehensive guide, 'Community CollegeS: A to Z.' From academic programs to student support services, this article provides a look at everything community colleges have to offer.

Did You Know?

For Virginia public community colleges, the average tuition is approximately $3,748 per year for in-state students and $8,977 for out-of-state students. For private community colleges, the average yearly tuition is approximately $15,590 per year. Read more about average community college tuition costs across the country.

The average community college acceptance rate in Virginia is 72%. Read more about national community college acceptance rates.

Virginia community colleges have a diversity score of 0.67, which is lower than the national average of 0.70. The most diverse community college in Virginia is Northern Virginia Community College. Read more about community college diversity statistics in the USA.

Quick Links