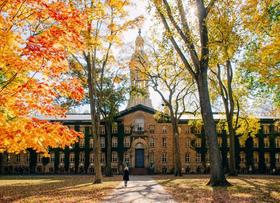
- A community college that has been making a difference in southeastern Illinois since 1963. OCC offers several two-year baccalaureate-oriented transfer degrees and more than 25 two-year technical degrees and certificates. Most degree programs are offered in both day and evening format and several courses are offered in an online format. On-campus students have an added opportunity to participate in inter-collegiate sports, music, band, several choirs, and various theater productions. The beautiful 100-plus acre campus is located adjacent to Illinois Route 130 in the northwestern section of Olney, Illinois.
School Highlights
Olney Central College serves 1,230 students (48% of students are full-time).
The college's student-teacher ratio of 12:1 is lower than the state community college average of 21:1.
Minority enrollment is 13% of the student body (majority Hispanic), which is less than the state average of 53%.
Quick Facts (2026)
- Enrollment: 1,230 students
- In-state tuition: $9,079
- Out-state tuition: $11,070
- Acceptance Rate: 94%
- Student-teacher ratio: 12:1
- Minority enrollment: 13%
- Source: Integrated Postsecondary Education Data System (IPEDS)
Top Rankings
Olney Central College ranks among the top 20% of public schools in Illinois for:
Category
Attribute
School Resources
Completion Rates
School Overview
The teacher population of 101 teachers has stayed relatively flat over five years.
Olney Central College
(IL) Community College Avg.
Carnegie Classification
Associate's Colleges: High Career & Technical-Mixed Traditional/Nontraditional
Associate's Colleges: Mixed Transfer/Career & Technical-High Nontraditional
Institution Level
At least 2 but less than 4 years
At least 2 but less than 4 years
Institution Control
Public
Public
Year Founded
1963
Colors
White, Blue
Total Faculty
101 staff
239 staff
School Calendar
Student Body
The student population of Olney Central College has grown by 35% over five years.
The student-teacher ratio of 12:1 has decreased from 24:1 over five years.
The Olney Central College diversity score of 0.24 is less than the state average of 0.69. The school's diversity has grown by 79% over five years.
Total Enrollment
1,230 students
3,838 students
Student-Teacher Ratio
12:1
21:1
# Full-Time Students
590 students
1,091 students
# Part-Time Students
640 students
2,747 students
# Enrollment Undergraduate
123 students
328 students
# Full-Time Undergraduate Students
590 students
1,091 students
# Full-Time Graduate Students
n/a
43 students
# Part-Time Undergraduate Students
640 students
3,310 students
# Part-Time Graduate Students
n/a
18 students
Total Dormitory Capacity
n/a
132 students
% American Indian/Alaskan
n/a
n/a
% Asian
1%
6%
% Hispanic
3%
26%
% Black
1%
13%
% White
87%
47%
% Hawaiian
n/a
n/a
% Two or more races
2%
3%
% Non Resident races
n/a
1%
% Unknown races
5%
4%
Diversity Score
0.24
0.69
College Completion Rate (Students who graduate in less than 4 years)
59%
40%
College Completion Rate (Students who graduate in 4 years or more than 4 years)
n/a
55%
Average Graduate Earnings (10 Years)
$30,400
$31,800
Tuition and Acceptance Rate
The public in-state tuition of $9,079 is more than the state average of $7,875. The in-state tuition has declined by 9% over four years.
The public out-state tuition of $11,070 is more than the state average of $10,847. The out-state tuition has declined by 8% over four years.
In-State Tuition Fees
$9,079
$7,875
Out-State Tuition Fees
$11,070
$10,847
% Students Receiving Some Financial Aid
95%
81%
Median Debt for Graduates
$6,400
$8,029
Median Debt for Dropouts
$4,675
$4,618
Acceptance Rate
94%
89%
SAT Reading
n/a
390
SAT Math
n/a
360
SAT Writing
n/a
355
ACT Composite
n/a
17
ACT English
n/a
17
ACT Math
n/a
17
Source: 2024 (or latest year available) Integrated Postsecondary Education Data System (IPEDS) , School Administrators
School Notes
- School Mascot: Blue Knight
- Our faculty is dedicated to offering each student a quality classroom experience with individualized attention. The new Associate in Science and Arts degree, one of five transfer degrees offered by IECC, provides a well-articulated course curriculum, which eases your transfer to Illinois' four-year universities. Our four colleges are among the first in the state to offer this diverse degree. IECC offers a variety of technical programs, including computer technology, industrial quality management, manufacturing technologies, and telecommunications, that lead to successful careers in industry and business. Our health career opportunities provide many area health-care facilities with highly trained and qualified personnel. Our alliance with Franklin University offers IECC students new opportunities for completing an on-line baccalaureate degree, while balancing work and family responsibilities. Through the newest technologies, we offer student involvement with our entire network, including on-line registration. With the service Entrata, students have the ability to access classroom and campus information from any computer, anywhere. IECC's partnership with the Illinois Virtual Campus offers students on-line classes that fit into their schedules and educational goals.
Frequently Asked Questions
How much does Olney Central College cost?
Olney Central College's tuition is approximately $9,079 for In-State students and $11,070 for Out-State students.
What schools are Olney Central College often compared to?
Olney Central Collegeis often viewed alongside schools like Lincoln Trail College, Frontier Community College by visitors of our site.
What is the acceptance rate of Olney Central College?
The acceptance rate of Olney Central College is 94%, which is higher than the state average of 89%.
What is Olney Central College's ranking?
Olney Central College ranks among the top 20% of community college in Illinois for: Percent of students receiving financial aid and Highest completion rates.
Recent Articles

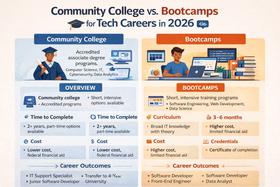
Community College vs. Bootcamps for Tech Careers in 2026
Community college vs. bootcamps in 2026. Compare cost, outcomes, credentials, and hiring trends to choose the best tech career path.

How to Build a Class Schedule That Fits Your Life (Spring 2026)
Learn how to build a class schedule that fits your life with expert tips, updated strategies for Spring 2026, and practical planning tools for students and families.

Top 10 Jobs for Community College Graduates in 2026
Meta Description: Discover high-demand jobs for community college graduates, with current salary trends, costs, and career pathways.


