School Highlights
Institute of Technology serves 2,073 students (97% of students are full-time).
The college's student-teacher ratio of 10:1 is lower than the state community college average of 32:1.
Minority enrollment is 68% of the student body (majority Hispanic), which is less than the state average of 77%.
Quick Facts (2026)
- Enrollment: 2,073 students
- Student-teacher ratio: 10:1
- Minority enrollment: 68%
- Source: Integrated Postsecondary Education Data System (IPEDS)
Top Rankings
Institute of Technology ranks among the top 20% of public schools in California for:
Category
Attribute
School Resources
Completion Rates
School Overview
The teacher population of 199 teachers has stayed relatively flat over five years.
Institute of Technology
(CA) Community College Avg.
Carnegie Classification
Associate's Colleges: High Career & Technical-Mixed Traditional/Nontraditional
Baccalaureate/Associate's Colleges: Associate's Dominant
Institution Level
At least 2 but less than 4 years
At least 2 but less than 4 years
Institution Control
Private for-profit
Public
Total Faculty
199 staff
315 staff
Number of Programs Offered
14
12
School Calendar
Student Body
The student population of Institute of Technology has grown by 62% over five years.
The student-teacher ratio of 10:1 has decreased from 16:1 over five years.
The Institute of Technology diversity score of 0.69 is less than the state average of 0.70. The school's diversity has stayed relatively flat over five years.
Total Enrollment
2,073 students
9,796 students
Student-Teacher Ratio
10:1
32:1
# Full-Time Students
2,005 students
1,259 students
# Part-Time Students
68 students
8,537 students
# Enrollment Undergraduate
207 students
242 students
# Full-Time Undergraduate Students
2,005 students
1,250 students
# Full-Time Graduate Students
n/a
63 students
# Part-Time Undergraduate Students
68 students
8,299 students
# Part-Time Graduate Students
n/a
10 students
Total Dormitory Capacity
n/a
121 students
% American Indian/Alaskan
1%
n/a
% Asian
8%
13%
% Hispanic
44%
47%
% Black
6%
7%
% White
32%
23%
% Hawaiian
1%
1%
% Two or more races
4%
5%
% Non Resident races
n/a
1%
% Unknown races
4%
3%
Diversity Score
0.69
0.70
College Completion Rate (Students who graduate in less than 4 years)
71%
42%
College Completion Rate (Students who graduate in 4 years or more than 4 years)
n/a
43%
Average Graduate Earnings (10 Years)
$28,800
$34,700
Tuition and Acceptance Rate
% Students Receiving Some Financial Aid
96%
85%
Median Debt for Graduates
$9,500
$10,500
Median Debt for Dropouts
$4,750
$6,239
Acceptance Rate
n/a
93%
Source: 2024 (or latest year available) Integrated Postsecondary Education Data System (IPEDS)
Frequently Asked Questions
What is Institute of Technology's ranking?
Institute of Technology ranks among the top 20% of community college in California for: Percent of students receiving financial aid and Highest completion rates.
Recent Articles

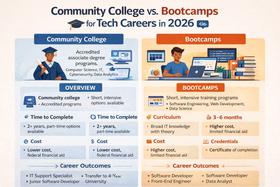
Community College vs. Bootcamps for Tech Careers in 2026
Community college vs. bootcamps in 2026. Compare cost, outcomes, credentials, and hiring trends to choose the best tech career path.

How to Build a Class Schedule That Fits Your Life (Spring 2026)
Learn how to build a class schedule that fits your life with expert tips, updated strategies for Spring 2026, and practical planning tools for students and families.

Top 10 Jobs for Community College Graduates in 2026
Meta Description: Discover high-demand jobs for community college graduates, with current salary trends, costs, and career pathways.


![[Genius India] Part.1 Indian Institute of Technology | KBS 230504India's population overtook China to become the No. 1 country in population. It is no exaggeration to say that the Indian community is controlling the world now in 2023. Indian-born people are in politics and industry around the world, and they occupy CEO positions in global companies such as Google, MS, and Adobe, dominating Silicon Valley. Indian Institute of Technology has a huge competition rate to match its reputation as India's best prestigious university. I visited the IIT Madras campus to closely cover their daily lives, where nothing was unordinary, from class time, meal time, or even break time.#다큐인사이트 #GeniusIndia #जीनियसभारत #DocumentaryInsight #documentary #india #indian #भारतीय #भारत #जीनियसभारत #kbsdocumentary #KBSडॉक्यूमेंटरी➕ Music Bank
2023 : https://youtube.com/playlist?list=PLMf7VY8La5RHGe90QRg_fH__B1NrbOcOb
2022 : https://youtube.com/playlist?list=PLMf7VY8La5REOohUTNebLTtU4Je5V4vft
2021 : https://youtube.com/playlist?list=PLMf7VY8La5RExE1YkVdBCHpaLsay2SnNa
➕ Song Festival
2022 : https://youtube.com/playlist?list=PLMf7VY8La5RHbkr3Re0fXA38MVoyNI0R9
2021 : https://youtube.com/playlist?list=PLMf7VY8La5REQ1HJ1KqjWsZ9tTDKM1fgI
2020 : https://youtube.com/playlist?list=PLMf7VY8La5RGym7CKoCfDFz_qb_WxU8Ry
➕ Never Stop! Online Compilation Concert
Season #2 : https://youtube.com/playlist?list=PLMf7VY8La5RHtUcGjsT8qmRhfJG1ICQDo
Season #1 : https://youtube.com/playlist?list=PLMf7VY8La5RFFgnKp0iiXwKX39EGzhsDF
➕ Exclusive
BTS Stage : https://youtube.com/playlist?list=PLMf7VY8La5RFAM6Sgg4M9SkyGIusuhnac
Editor's Pick! : https://youtube.com/playlist?list=PLMf7VY8La5RG9xT3U4l0GAPuA4CdeIi3R
➕ LEGEND Video :
https://youtube.com/playlist?list=PLMf7VY8La5RFS0XWTWFycvquksqgPeQ80➕ Subscribe KBS WORLD TV Official Pages
Youtube Subscribe:https://www.youtube.com/kbsworld
Homepage : http://www.kbsworld.co.kr
Facebook : http://www.facebook.com/kbsworld
Twitter : http://twitter.com/kbsworldtv
Instagram : https://www.instagram.com/kbsw [Genius India] Part.1 Indian Institute of Technology | KBS 230504](https://i.ytimg.com/vi/y1-4ZMA6miY/0.jpg)


