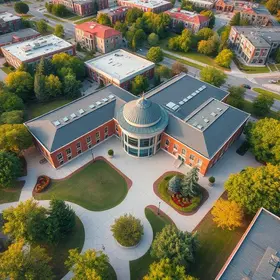
Central Virginia Community College

3506 Wards Rd
Lynchburg, VA 24502
Top-Ranked (2026-27): View Rankings
  • Central Virginia Community College, a two-year institution established as a member of the Virginia Community College System, provides State-supported educational facilities beyond the high school level for the cities of Lynchburg and Bedford and the counties of Amherst, Appomattox, Bedford, and Campbell. The curricula and programs of the College serve more than 228,000 people within this geographical jurisdiction.

School Highlights

Central Virginia Community College serves 3,481 students (32% of students are full-time).
The college's student-teacher ratio of 31:1 is lower than the state community college average of 37:1.
Minority enrollment is 36% of the student body (majority Black), which is less than the state average of 55%.

Quick Facts (26-27)

  • Enrollment: 3,481 students
  • In-state tuition: $4,248
  • Out-state tuition: $10,068
  • Acceptance Rate: 65%
  • Student-teacher ratio: 31:1
  • Minority enrollment: 36%
  • Source: Integrated Postsecondary Education Data System (IPEDS)

Top Rankings

Central Virginia Community College ranks among the top 20% of public schools in Virginia for:

Category
Attribute

School Overview

The teacher population of 111 teachers has declined by 52% over five years.
Central Virginia Community College
(VA) Community College Avg.
Carnegie Classification
Associate's Colleges
Institution Level
At least 2 but less than 4 years
Institution Control
Public
Private, non-profit
Year Founded
1966
Total Faculty
111 staff
39 staff
School Calendar
AccreditationAccred.
Joint Review Committee on Education in Radiologic Technology (JRCERT)

Student Body

The student population of Central Virginia Community College has stayed relatively flat over five years.
The student-teacher ratio of 31:1 has increased from 16:1 over five years.
The Central Virginia Community College diversity score of 0.55 is less than the state average of 0.72. The school's diversity has grown by 37% over five years.
Total Enrollment
3,481 students
1,380 students

Showing 2013–2025. Full 19-year historical data available below ↓

Student-Teacher Ratio
31:1
37:1

Showing 2008–2025. Full 19-year historical data available below ↓

# Full-Time Students
1,131 students
585 students

Showing 2012–2025. Full 19-year historical data available below ↓

# Part-Time Students
2,350 students
795 students

Showing 2012–2025. Full 19-year historical data available below ↓

# Enrollment Undergraduate
3,481 students
924 students
# Full-Time Undergraduate Students
1,131 students
415 students

Showing 2013–2025. Full 19-year historical data available below ↓

# Part-Time Undergraduate Students
2,350 students
795 students
% Asian
2%
8%

Showing 2008–2025. Full 19-year historical data available below ↓

% Hispanic
5%
14%

Showing 2008–2025. Full 19-year historical data available below ↓

% Black
19%
22%

Showing 2010–2025. Full 19-year historical data available below ↓

% White
64%
45%

Showing 2010–2025. Full 19-year historical data available below ↓

% Two or more races
6%
5%
% Non Resident races
1%
2%
% Unknown races
2%
4%
Diversity Score
0.55
0.72

Showing 2011–2025. Full 19-year historical data available below ↓

College Completion Rate (Students who graduate in less than 4 years)
28%
42%

Showing 2015–2025. Full 19-year historical data available below ↓

Average Graduate Earnings (10 Years)
$29,400
$29,700

Tuition & Financial Aid

The public in-state tuition of $4,248 is more than the state average of $3,581. The in-state tuition has declined by 12% over four years.
The public out-state tuition of $10,068 is more than the state average of $8,577. The out-state tuition has declined by 7% over four years.
In-State Tuition Fees
$4,248
$3,581
Out-State Tuition Fees
$10,068
$8,577
% Students Receiving Some Financial Aid
81%
86%

Showing 2013–2025. Full 19-year historical data available below ↓

Median Debt for Graduates
$8,515
$10,500
Median Debt for Dropouts
$5,200
$5,500
Acceptance Rate
65%
75%

Sports

School Mascot
Cougar
Source: 2025 (or latest year available) Integrated Postsecondary Education Data System (IPEDS) , School Administrators

School Notes

  • Early in 1965, a local committee was formed to investigate the needs and feasibility of a community college for the Central Virginia region; and in July, 1966, the State Board for Community Colleges selected Central Virginia as a community college location to serve the cities of Lynchburg and Bedford and the counties of Amherst, Appomattox, Bedford and Campbell. The site selected, where Central Virginia Community College presently stands, was approved by the State and Local Boards because of its geographic center to the service area's population and accessibility to all major highways in the area. With academic excellence its aim in all areas, the College offers various programs to meet the diverse needs of the region it serves. Its two-year college transfer programs in arts and sciences and in certain pre-professional areas lead to associate degrees and offer courses generally acceptable for transfer to four-year institutions. Its occupational and technical programs lead to diplomas, certificates, or associate of applied science degrees and are designed to prepare individuals for certain professions. Its other programs, including developmental work, special training for industry, and community service, offer instruction commensurate with the needs of individuals, groups or the area at large.

Frequently Asked Questions

How much does Central Virginia Community College cost?
Central Virginia Community College's tuition is approximately $4,248 for In-State students and $10,068 for Out-State students.
What is the acceptance rate of Central Virginia Community College?
The acceptance rate of Central Virginia Community College is 65%, which is lower than the state average of 75%.
What is Central Virginia Community College's ranking?
Central Virginia Community College ranks among the top 20% of community college in Virginia for: Least debt for graduating students.

Recent Articles

Licensure Pass Rates: What Students Should Check
Learn how to evaluate licensure pass rates before enrolling in community college career programs, compare exam results, identify warning signs, and choose training that supports professional licensing and employment goals.
Do Your Transfer Credits Count Toward Your Major?
A college course may transfer without counting toward your major. Learn how to check degree requirements, identify elective credits, avoid graduation delays, and protect your community college transfer plan.
Transfer With 45 Credits, 60 Credits, or a Degree?
Should you transfer with 45 credits, 60 credits, or an associate degree? Compare university requirements, tuition savings, graduation timelines, and transfer benefits to choose the best path for your goals.

Quick Facts (26-27)

  • Enrollment: 3,481 students
  • In-state tuition: $4,248
  • Out-state tuition: $10,068
  • Acceptance Rate: 65%
  • Student-teacher ratio: 31:1
  • Minority enrollment: 36%
  • Source: Integrated Postsecondary Education Data System (IPEDS)

Related School Videos

Quick Links