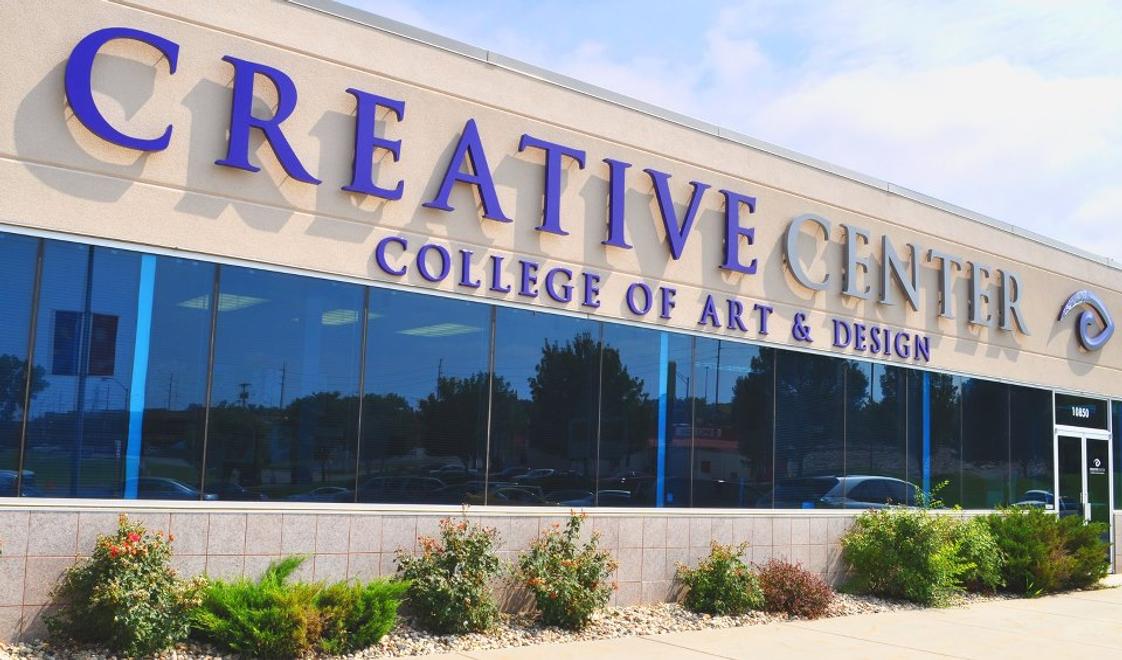
- Creative Center students earn a Bachelor of Fine Arts degree in Graphic Design in only three years. Utilizing art-specialized education and classes five days per week, students complete more credit hours per semester.In short, Creative Center students can graduate and be employed in a job they love - sooner.
School Highlights
The Creative Center served 24 students (100% of students were full-time).
The college's student-teacher ratio of 2:1 was lower than the state community college average of 16:1.
Minority enrollment was 46% of the student body (majority Asian), which was more than the state average of 37%.
School Overview
The Creative Center
(NE) Community College Avg.
Carnegie Classification
Not applicable, not in Carnegie universe (not accredited or nondegree-granting)
Not applicable, not in Carnegie universe (not accredited or nondegree-granting)
Institution Level
Less than 2 yrs
At least 2 but less than 4 years
Institution Control
Public
Private not-for-profit
Total Faculty
10 staff
233 staff
Student Body
Total Enrollment
24 students
1,449 students
Student-Teacher Ratio
2:1
16:1
# Full-Time Students
24 students
127 students
# Part-Time Students
1 students
1,322 students
# Enrollment Undergraduate
63 students
26 students
# Full-Time Undergraduate Students
24 students
114 students
# Full-Time Graduate Students
n/a
14 students
# Part-Time Undergraduate Students
n/a
1,322 students
Total Dormitory Capacity
n/a
357 students
% American Indian/Alaskan
3%
1%
% Asian
11%
3%
% Hispanic
3%
16%
% Black
n/a
6%
% White
54%
63%
% Hawaiian
n/a
2%
% Two or more races
3%
3%
% Non Resident races
26%
1%
% Unknown races
n/a
5%
Diversity Score
0.63
0.57
College Completion Rate (Students who graduate in less than 4 years)
n/a
45%
College Completion Rate (Students who graduate in 4 years or more than 4 years)
15%
n/a
Average Graduate Earnings (10 Years)
$35,400
$35,400
Tuition and Acceptance Rate
% Students Receiving Some Financial Aid
91%
81%
Median Debt for Graduates
$12,000
$12,000
Median Debt for Dropouts
$10,750
$4,500
Acceptance Rate
74%
74%
Source: 2021 (or latest year available) Integrated Postsecondary Education Data System (IPEDS) , School Administrators
School Notes
Enrollment and Acceptance Steps: The Creative Center accepts
applications from students who attend public, private, or
homeschool high school venues.In order to enroll, students
must have or be on track to receive their high school diploma or
its equivalent. Students can be conditionally accepted with an
in-progress high school transcript, however, in order to be fully
accepted, an official high school transcript or its
equivalentmust be filed at the Creative Center. The enrollee
is responsible for providing the final, official high school
transcript.
- Step 1: Enrollment Procedure: To reserve a place at the Creative Center, the prospective student must visit the campus. During the campus visit: 1) An Admissions Coordinator will conduct a one-time personal interview to explain the enrollment process and eligibility. 2) We will tour the campus. (NOTE: All applicants under the age of 24 must be accompanied by a parent or guardian for the interview and tour.) 3) When students enroll they must complete an enrollment agreement and application form, and provide a $200 enrollment fee and a $100 application fee. (NOTE: If accepted, the Application Fee is non-refundable, and the $200 Enrollment Fee will be applied to the tuition. The full $300 is refunded if the student is denied acceptance.) NOTE: At this time the student must decide whether to enroll into the AOS or both the AOS and BFA programs. If the student chooses to enroll into the BFA program at a later date, an additional enrollment fee will take effect, however, an application or portfolio will not be required.
- Step 2: Acceptance Procedure: After enrolling, prospective students must submit the following four (4) items to the Creative Center for acceptance: 1) A Portfolio (see Portfolio Requirements, page 17, for details). 2) A one-page letter explaining why the student wishes to attend the Creative Center. 3) A letter of recommendation, preferably from a high school art teacher. 4) A final, official, high school transcript or GED results. (A current high school transcript can be submitted if the student is still attending.) NOTE: Students who provide GED results may also be asked to provide an official high school transcript.
- Step 3: Acceptance and Scholarship Notification: After the acceptance committee has reviewed the application, they will determine if the student can be accepted. Students who have submitted a final, official transcript are eligible for acceptance. Students who have submitted a current transcript and are still attending high school are eligible for conditional acceptance. Once accepted (in either capacity) the student will receive an acceptance packet by mail. At this time the student will also be notified of any scholarships from the Creative Center. Students who are conditionally accepted must submit a final, official transcript to the Creative Center before they will be accepted and allowed to attend classes. NOTE: The full $300 is refunded if for any reason a student is denied acceptance.
- Step 4: Financial Aid: Once the Creative Center has mailed the acceptance packet, students and their parents/guardians must call the Financial Aid Office to make an appointment. The Financial Aid Office will provide a list of certain items to be brought to this meeting. Please bring the information pertaining to the parent(s)/guardian with whom the student lived most during the previous calendar year.
Frequently Asked Questions
What is the acceptance rate of The Creative Center?
The acceptance rate of The Creative Center is 74%, which is equal to the state average of 74%.
Recent Articles

5 Key Community College Trends Parents Should Know in 2026
Explore major 2026 community college trends including enrollment changes, costs, career programs, and affordability for parents planning college decisions.
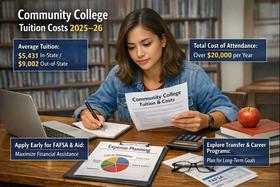
Average Community College Tuition Cost 2026 Update
Explore updated 2026 community college tuition averages, cost trends, planning tips, admissions timing advice, and financial strategies for families and students.
Preparing for Placement Tests in 2026: Student Guide
Preparing for Placement Tests in 2026, what students, parents, and educators need to know about formats, prep strategies, and placement changes.

