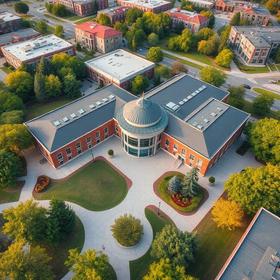
- St. Vincent's College is a community-based Catholic College providing an education in nursing and allied health, and the liberal arts and sciences.
School Highlights
St Vincent's College serves 751 students (10% of students are full-time).
The college's student-teacher ratio of 15:1 is lower than the state community college average of 26:1.
Minority enrollment is 25% of the student body (majority Hispanic and Black), which is less than the state average of 72%.
Quick Facts (2026)
- Enrollment: 751 students
- Private-state tuition: $16,200
- Acceptance Rate: 38%
- Student-teacher ratio: 15:1
- Minority enrollment: 25%
- Source: Integrated Postsecondary Education Data System (IPEDS)
Top Rankings
St Vincent's College ranks among the top 20% of public schools in Connecticut for:
Category
Attribute
Selectivity
School Overview
The teacher population of 49 teachers has stayed relatively flat over five years.
St Vincent's College
(CT) Community College Avg.
Carnegie Classification
Associates Colleges
Associates Colleges
Institution Level
Less than 2 yrs
Four or more years
Institution Control
Private, non-profit
Public
Total Faculty
49 staff
154 staff
School Calendar
Student Body
The student population of St Vincent's College has stayed relatively flat over five years.
The student-teacher ratio of 15:1 has stayed the same over five years.
The St Vincent's College diversity score of 0.41 is less than the state average of 0.81. The school's diversity has stayed relatively flat over five years.
Total Enrollment
751 students
1,483 students
Student-Teacher Ratio
15:1
26:1
# Full-Time Students
78 students
770 students
# Part-Time Students
673 students
713 students
# Enrollment Undergraduate
490 students
352 students
# Full-Time Undergraduate Students
78 students
770 students
# Full-Time Graduate Students
n/a
27 students
# Part-Time Undergraduate Students
n/a
1,218 students
# Part-Time Graduate Students
n/a
144 students
Total Dormitory Capacity
n/a
550 students
% American Indian/Alaskan
n/a
2%
% Asian
3%
9%
% Hispanic
12%
17%
% Black
10%
20%
% White
75%
28%
% Hawaiian
n/a
17%
% Two or more races
n/a
3%
% Non Resident races
n/a
2%
% Unknown races
n/a
2%
Diversity Score
0.41
0.81
College Completion Rate (Students who graduate in less than 4 years)
100%
10%
College Completion Rate (Students who graduate in 4 years or more than 4 years)
n/a
60%
Average Graduate Earnings (10 Years)
$62,500
$34,800
Tuition and Acceptance Rate
The private state tuition of $16,200 is less than the state average of $21,887. The private state tuition has grown by 11% over four years.
Private State Tuition Fees
$16,200
$21,887
% Students Receiving Some Financial Aid
100%
78%
Median Debt for Graduates
$22,000
$5,500
Median Debt for Dropouts
$9,500
$4,400
Acceptance Rate
38%
78%
SAT Reading
n/a
500
SAT Math
n/a
510
ACT Composite
n/a
23
Source: 2023 (or latest year available) Integrated Postsecondary Education Data System (IPEDS)
School Notes
- St. Vincent's, established in 1905, is a community based Catholic College providing an education in nursing, allied health, and the liberal arts and sciences. Its mission is derived from the historic commitment of the Daughters of Charity of St. Vincent De Paul to care for the sick poor and to educate others for the health care ministry. The core values of Ascension Health guide the College in its service to others: Service of the Poor, Reverence, Integrity, Wisdom, Creativity, and Dedication based upon an environment which supports Judeo-Christian values. St. Vincent's College is an affiliate of St. Vincent's Medical Center which provides a wealth of clinical experience for students. Serving Southwestern Connecticut and Westchester County, New York, St. Vincent's Medical Center is a modern, 397-bed acute care hospital offering more than 50 specialty and subspecialty medical and surgical disciplines. Through its dedicated and highly qualified faculty and staff, the College offers associate degrees in Nursing, Radiography, Medical Assisting, and General Studies. Certificate programs are offered in Medical Assisting, Diagnostic Medical Sonography, Central Sterile Processing, Health Promotion, Hospital Coding and other allied health fields. The Continuing Education Division provides numerous credit and non-credit courses and programs to help individuals upgrade their skills or prepare for new careers. St. Vincent's College is licensed and accredited by the State of Connecticut Board of Governors for Higher Education. The College is authorized to award Associate in Science degrees in Allied Health Fields and General Studies. St. Vincent's College is accredited by the New England Association of Schools and Colleges, Inc., through its Commission on Institutions of Higher Education.
Frequently Asked Questions
How much does St Vincent's College cost?
St Vincent's College's private state tuition is approximately $16,200.
What schools are St Vincent's College often compared to?
St Vincent's Collegeis often viewed alongside schools like Northwestern Connecticut Community College by visitors of our site.
What is the acceptance rate of St Vincent's College?
The acceptance rate of St Vincent's College is 38%, which is lower than the state average of 78%. St Vincent's College's acceptance rate is ranked among the top community colleges in Connecticut with low acceptance rates.
What is St Vincent's College's ranking?
St Vincent's College ranks among the top 20% of community college in Connecticut for: Lowest acceptance rates.
In what neighborhood is St Vincent's College located?
St Vincent's College is located in the North Bridgeport neighborhood of Bridgeport, CT.
Recent Articles

5 Key Community College Trends Parents Should Know in 2026
Explore major 2026 community college trends including enrollment changes, costs, career programs, and affordability for parents planning college decisions.

Average Community College Tuition Cost 2026 Update
Explore updated 2026 community college tuition averages, cost trends, planning tips, admissions timing advice, and financial strategies for families and students.

Preparing for Placement Tests in 2026: Student Guide
Preparing for Placement Tests in 2026, what students, parents, and educators need to know about formats, prep strategies, and placement changes.


