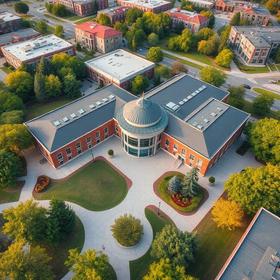
Pinnacle College (Closed 2015)

1000 South Fremont Avenue Bldg A-11 Ste 11010
Alhambra, CA 91803

School Highlights

Pinnacle College served 179 students (100% of students were full-time).
The college's student:teacher ratio of 15:1 was lower than the state community college average of 22:1.
Minority enrollment was 76% of the student body (majority Hispanic and Black), which was more than the state average of 74%.

School Overview

Pinnacle College
(CA) Community College Avg.
Institution Level
Less than 2 yrs
At least 2 but less than 4 years
Institution Control
Public
Public
Total Faculty
12 staff
308 staff
This chart display total faculty of Pinnacle College and community college average number of faculty in CA by year, with the latest 2014-15 school year data.
Number of Programs Offered
3
11

Student Body

Total Enrollment
179 students
7,899 students
This chart display the total enrollment of Pinnacle College and community college average number of enrollment of CA by year, with the latest 2014-15 school year data.
Student : Teacher Ratio
15:1
22:1
This chart display the student staff ratio of Pinnacle College and community college average student staff ratio of CA by year, with the latest 2014-15 school year data.
# Full-Time Students
179 students
1,660 students
This chart display the total number of Full-time students enrollment of Pinnacle College and average number of community college Full-time students enrollment of CA by year, with the latest 2014-15 school year data.
# Part-Time Students
n/a
6,239 students
This chart display the Full-time students and Part-time students enrollment breakdown of Pinnacle College.
This chart display community college average Full-Time students and Part-Time students enrollment breakdown of CA.
# Enrollment Undergraduate
444 students
302 students
# Full-Time Undergraduate Students
179 students
1,580 students
This chart display the total number of Full-time undergraduate students enrollment of Pinnacle College and average number of community college Full-time undergraduate  students enrollment of CA by year, with the latest 2014-15 school year data.
# Full-Time Graduate Students
n/a
54 students
# Part-Time Undergraduate Students
n/a
6,239 students
# Part-Time Graduate Students
n/a
10 students
Total Dormitory Capacity
n/a
140 students
% American Indian/Alaskan
n/a
n/a
This chart display the percentage of American Indian/Alaskan students in Pinnacle College and the percentage of American Indian/Alaskan community college students in CA by year, with the latest 2009-10 school year data.
% Asian
6%
14%
This chart display the percentage of Asian students in Pinnacle College and the percentage of Asian community college students in CA by year, with the latest 2014-15 school year data.
% Hispanic
33%
45%
This chart display the percentage of Hispanic students in Pinnacle College and the percentage of Hispanic community college students in CA by year, with the latest 2014-15 school year data.
% Black
32%
5%
This chart display the percentage of Black students in Pinnacle College and the percentage of Black community college students in CA by year, with the latest 2014-15 school year data.
% White
24%
26%
This chart display the percentage of White students in Pinnacle College and the percentage of White community college students in CA by year, with the latest 2014-15 school year data.
% Hawaiian
n/a
n/a
This chart display the percentage of Hawaiian students in Pinnacle College and the percentage of Hawaiian community college students in CA by year, with the latest 2012-13 school year data.
% Two or more races
5%
4%
This chart display the percentage of Two or more races students in Pinnacle College and the percentage of Two or more races community college students in CA by year, with the latest 2014-15 school year data.
% Non Resident races
n/a
3%
% Unknown races
n/a
3%
This chart display the percentage breakdown of students of all ethnic groups in Pinnacle College.
This chart display the percentage breakdown of students of all ethnic groups in CA.
Diversity Score
0.73
0.70
This chart display the diversity score of Pinnacle College and the community college average diversity score of CA by year, with the latest 2014-15 school year data.
College Completion Rate (Students who graduate in less than 4 years)
79%
28%
This chart display completion rates for First-Time of Full-time students of Pinnacle College and community college average completion rates for First-Time of Full-time students of CA by year, with the latest 2014-15 school year data.
College Completion Rate (Students who graduate in 4 years or more than 4 years)
n/a
1.92%
Average Graduate Earnings (10 Years)
$33,900
$34,700
This chart display average graduate earnings (10 Years) of Pinnacle College and community college average graduate earnings (10 Years) of CA by year, disaggregated by student subgroups with the latest 2012-13 school year data.

Tuition and Acceptance Rate

% Students Receiving Some Financial Aid
95%
77%
This chart display the percent of students who is receiving some financial aid in Pinnacle College and the percent of community college students who is receiving some financial aid in CA by year, with the latest 2012-13 school year data.
Median Debt for Graduates
$21,000
$9,500
This chart display median debt for students who have completed a certificate or degree in Pinnacle College and average median debt for community college students who have completed a certificate or degree in CA by year, with the latest 2014-15 school year data.
Median Debt for Dropouts
$8,075
$5,500
This chart display median debt for students who have not completed a certificate or degree in Pinnacle College and average median debt for community college students who have not completed a certificate or degree in CA by year, with the latest 2014-15 school year data.
Acceptance Rate
n/a
89%
Source: 2015 (or latest year available) Integrated Postsecondary Education Data System (IPEDS)

Recent Articles

Why More Students are Turning to Community College Today
We look at why millions of Americans are choosing community college over a traditional four-year school today.
Culinary Arts, Athletics, Massage Therapy and More: Programs Cut at Community Colleges
Against massive budget cuts, community colleges have been forced to take drastic measures, including cutting entire programs ranging from the culinary arts to athletics.
Careers: Sustainable Agriculture
July 16, 2023
Careers: Sustainable Agriculture
Discover the promising world of sustainable agriculture and explore the diverse careers it offers for those passionate about building a greener future. From eco-friendly farming practices and cutting-edge agri-tech to impactful roles in supply chain management and impact investment, this article sheds light on how professionals in sustainable agriculture are shaping a more sustainable and resilient global food system.

Did You Know?

For Los Angeles County, CA public community colleges, the average tuition is approximately $1,211 per year for in-state students and $6,572 for out-of-state students. For private community colleges, the average yearly tuition is approximately $24,568 per year. Read more about average community college tuition costs across the country.

The average community college acceptance rate in Los Angeles County, CA is 75%. Read more about national community college acceptance rates.

Los Angeles County, CA community colleges have a diversity score of 0.67, which is lower than the national average of 0.70. The most diverse community college in Los Angeles County, CA is Los Angeles Film School. Read more about community college diversity statistics in the USA.

Quick Links