- Ogden鈥揥eber Technical College is a public technical college in Ogden, Utah. It is one of the largest of the eight technical colleges within the Utah System of Higher Education. The college offers open-entry, open-exit, competency-based education targeted at technical skills and job placement.
School Highlights
Ogden-Weber Technical College serves 4,719 students (13% of students are full-time).
The college's student-teacher ratio of 19:1 is higher than the state community college average of 16:1.
Minority enrollment is 39% of the student body (majority Hispanic), which is more than the state average of 29%.
Quick Facts (2026)
- Enrollment: 4,719 students
- Student-teacher ratio: 19:1
- Minority enrollment: 39%
- Source: Integrated Postsecondary Education Data System (IPEDS)
School Overview
The teacher population of 254 teachers has stayed relatively flat over five years.
Ogden-Weber Technical College
(UT) Community College Avg.
Carnegie Classification
Not applicable, not in Carnegie universe (not accredited or nondegree-granting)
Not applicable, not in Carnegie universe (not accredited or nondegree-granting)
Institution Level
Less than 2 yrs
Four or more years
Institution Control
Public
Public
Colors
Black, Red
Total Faculty
254 staff
215 staff
Number of Programs Offered
29
23
Student Body
The student population of Ogden-Weber Technical College has grown by 82% over five years.
The student-teacher ratio of 19:1 has decreased from 30:1 over five years.
The Ogden-Weber Technical College diversity score of 0.52 is more than the state average of 0.47. The school's diversity has grown by 14% over five years.
Total Enrollment
4,719 students
4,285 students
Student-Teacher Ratio
19:1
16:1
# Full-Time Students
593 students
891 students
# Part-Time Students
4,126 students
3,394 students
# Enrollment Undergraduate
471 students
367 students
# Full-Time Undergraduate Students
593 students
891 students
# Full-Time Graduate Students
n/a
133 students
# Part-Time Undergraduate Students
n/a
3,394 students
# Part-Time Graduate Students
n/a
563 students
Total Dormitory Capacity
n/a
750 students
% American Indian/Alaskan
1%
1%
% Asian
1%
2%
% Hispanic
31%
13%
% Black
2%
1%
% White
61%
71%
% Hawaiian
n/a
1%
% Two or more races
3%
3%
% Non Resident races
n/a
4%
% Unknown races
1%
4%
Diversity Score
0.52
0.47
College Completion Rate (Students who graduate in less than 4 years)
46%
65%
College Completion Rate (Students who graduate in 4 years or more than 4 years)
n/a
47%
Average Graduate Earnings (10 Years)
$27,000
$32,700
Tuition and Acceptance Rate
% Students Receiving Some Financial Aid
41%
73%
Median Debt for Graduates
n/a
$15,108
Median Debt for Dropouts
n/a
$6,334
Acceptance Rate
n/a
93%
SAT Reading
n/a
545
SAT Math
n/a
550
ACT Composite
n/a
23
ACT English
n/a
24
ACT Math
n/a
23
Source: 2024 (or latest year available) Integrated Postsecondary Education Data System (IPEDS) , School Administrators
Recent Articles

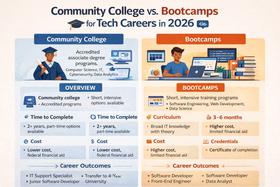
Community College vs. Bootcamps for Tech Careers in 2026
Community college vs. bootcamps in 2026. Compare cost, outcomes, credentials, and hiring trends to choose the best tech career path.

How to Build a Class Schedule That Fits Your Life (Spring 2026)
Learn how to build a class schedule that fits your life with expert tips, updated strategies for Spring 2026, and practical planning tools for students and families.

Top 10 Jobs for Community College Graduates in 2026
Meta Description: Discover high-demand jobs for community college graduates, with current salary trends, costs, and career pathways.


