- Northeast Louisiana Technical College (NELTC) campuses offer courses and programs that teach high demand skills needed to get a job, to cross-train for different positions, or to retrain for a new career. Students are provided with relevant, hands-on training to prepare them to enter and to advance in the 21st Century workforce. Emphasis is placed on current industry based certifications and standards to ensure that students obtain marketable skills. Northeast Louisiana Technical College (NELTC) campuses provide access and opportunity for Louisiana citizens to prepare for a career in high-wage, high-demand fields. The five NELTC campuses provide skilled employees for business and industry to support the overall economic development and workforce needs of the state and region.
School Highlights
Northeast Louisiana Technical College-Ruston served 254 students (38% of students were full-time).
Minority enrollment was 47% of the student body (majority Black), which was less than the state average of 60%.
School Overview
Northeast Louisiana Technical College-Ruston
(LA) Community College Avg.
Carnegie Classification
Associate's--Public Rural-serving Small
Associate's Colleges: Mixed Transfer/Vocational & Technical-High Nontraditional
Institution Level
At least 2 but less than 4 years
At least 2 yrs but < 4 yrs
Institution Control
Public
Public
Total Faculty
n/a
54 staff
Student Body
Total Enrollment
254 students
722 students
Student-Teacher Ratio
n/a
23:1
# Full-Time Students
96 students
329 students
# Part-Time Students
158 students
393 students
# Enrollment Undergraduate
n/a
394 students
# Full-Time Undergraduate Students
96 students
311 students
# Full-Time Graduate Students
n/a
17 students
# Part-Time Undergraduate Students
158 students
844 students
# Part-Time Graduate Students
n/a
1 students
Total Dormitory Capacity
n/a
217 students
% American Indian/Alaskan
1%
1%
% Asian
n/a
2%
% Hispanic
2%
5%
% Black
42%
41%
% White
53%
40%
% Hawaiian
n/a
1%
% Two or more races
n/a
2%
% Non Resident races
n/a
1%
% Unknown races
2%
7%
Diversity Score
0.54
0.66
College Completion Rate (Students who graduate in less than 4 years) (Year 2010)
47%
42%
College Completion Rate (Students who graduate in 4 years or more than 4 years)
n/a
31%
Average Graduate Earnings (10 Years) (Year 2010)
$31,000
$31,000
Tuition and Acceptance Rate
% Students Receiving Some Financial Aid
49%
76%
Median Debt for Graduates
n/a
$12,567
Median Debt for Dropouts
n/a
$5,500
Acceptance Rate
n/a
94%
ACT Composite
n/a
21
ACT English
n/a
21
ACT Math
n/a
20
Source: 2010 (or latest year available) Integrated Postsecondary Education Data System (IPEDS)
Recent Articles

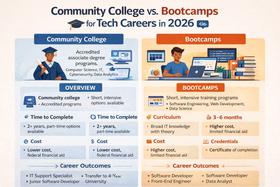
Community College vs. Bootcamps for Tech Careers in 2026
Community college vs. bootcamps in 2026. Compare cost, outcomes, credentials, and hiring trends to choose the best tech career path.

How to Build a Class Schedule That Fits Your Life (Spring 2026)
Learn how to build a class schedule that fits your life with expert tips, updated strategies for Spring 2026, and practical planning tools for students and families.

Top 10 Jobs for Community College Graduates in 2026
Meta Description: Discover high-demand jobs for community college graduates, with current salary trends, costs, and career pathways.


