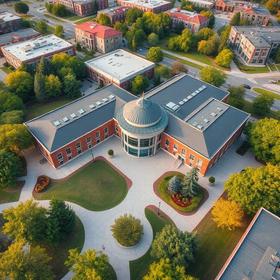
- Wilbur Wright College was established in 1934 by the Chicago Board of Education as one of the system of three city junior colleges designed to serve the post-secondary educational needs of Chicago citizens. Except for a three-year period during World War II, when the U.S. Navy took it over for training purposes, the college remained at 3400 N. Austin until the recent move to the new campus in 1993. In 1966, Wright and the other city colleges were reorganized into a new community college district, named the City Colleges of Chicago, with its own Board of Trustees and taxing authority.
School Highlights
City Colleges of Chicago-Wilbur Wright College serves 11,887 students (30% of students are full-time).
The college's student-teacher ratio of 32:1 is higher than the state community college average of 21:1.
Minority enrollment is 77% of the student body (majority Hispanic), which is more than the state average of 53%.
Quick Facts (2026)
- Enrollment: 11,887 students
- In-state tuition: $6,460
- Out-state tuition: $7,891
- Acceptance Rate: 33%
- Student-teacher ratio: 32:1
- Minority enrollment: 77%
- Source: Integrated Postsecondary Education Data System (IPEDS)
Top Rankings
City Colleges of Chicago-Wilbur Wright College ranks among the top 20% of public schools in Illinois for:
Category
Attribute
Affordability
Selectivity
Community Size
Debt For Students
School Overview
The teacher population of 377 teachers has stayed relatively flat over five years.
City Colleges of Chicago-Wilbur Wright College
(IL) Community College Avg.
Carnegie Classification
Associate's Colleges: High Transfer-High Nontraditional
Associate's Colleges: Mixed Transfer/Career & Technical-High Nontraditional
Institution Level
Less than 2 yrs
At least 2 but less than 4 years
Institution Control
Public
Public
Total Faculty
377 staff
239 staff
School Calendar
Student Body
The student population of City Colleges of Chicago-Wilbur Wright College has grown by 35% over five years.
The student-teacher ratio of 32:1 has decreased from 58:1 over five years.
The City Colleges of Chicago-Wilbur Wright College diversity score of 0.57 is less than the state average of 0.69. The school's diversity has grown by 5% over five years.
Total Enrollment
11,887 students
3,838 students
Student-Teacher Ratio
32:1
21:1
# Full-Time Students
3,544 students
1,091 students
# Part-Time Students
8,343 students
2,747 students
# Enrollment Undergraduate
118 students
328 students
# Full-Time Undergraduate Students
3,544 students
1,091 students
# Full-Time Graduate Students
n/a
43 students
# Part-Time Undergraduate Students
n/a
3,310 students
# Part-Time Graduate Students
n/a
18 students
Total Dormitory Capacity
n/a
132 students
% American Indian/Alaskan
n/a
n/a
% Asian
7%
6%
% Hispanic
61%
26%
% Black
6%
13%
% White
23%
47%
% Hawaiian
n/a
n/a
% Two or more races
2%
3%
% Non Resident races
1%
1%
% Unknown races
n/a
4%
Diversity Score
0.57
0.69
College Completion Rate (Students who graduate in less than 4 years)
30%
40%
College Completion Rate (Students who graduate in 4 years or more than 4 years)
n/a
55%
Average Graduate Earnings (10 Years)
$35,300
$31,800
Tuition and Acceptance Rate
The public in-state tuition of $6,460 is less than the state average of $7,875. The in-state tuition has declined by 43% over four years.
The public out-state tuition of $7,891 is less than the state average of $10,847. The out-state tuition has declined by 45% over four years.
In-State Tuition Fees
$6,460
$7,875
Out-State Tuition Fees
$7,891
$10,847
Tuition Notes
$153.00 per credit hour for in-district students.
% Students Receiving Some Financial Aid
85%
81%
Median Debt for Graduates
$5,900
$8,029
Median Debt for Dropouts
$3,750
$4,618
Acceptance Rate
33%
89%
SAT Reading
n/a
390
SAT Math
n/a
360
SAT Writing
n/a
355
ACT Composite
n/a
17
ACT English
n/a
17
ACT Math
n/a
17
Source: 2024 (or latest year available) Integrated Postsecondary Education Data System (IPEDS) , School Administrators
School Notes
- The Humboldt Park Vocational Education Center (HPVEC) of Wilbur Wright College is located at 1645 North California on Chicago's near northwest side. The center opened its doors in 1995, and serves as an education and training resource for the Humboldt Park/West Town Community. The Center provides community residents with occupational skills training in areas with high employment potential. Wright College education programs lead to Associate Degrees of 60 to 64 semester credit hours and Certificates for programs of less than 60 hours. Six types of Associate Degrees are offered. They are the Associate in Arts (A.A.), Associate of Fine Arts(A.F.A.), Associate in Science (A.S.), Associate of Engineering Science(A.E.S.), Associate in Applied Science (A.A.S.), Associate of General Studies (A.G.S.) and other Certificates & Programs. The Wright College Library provides the student with a variety of books, periodicals, and electronic material for study, course-related research, and personal growth. Our library resources are available online to assist our students in meeting their educational objectives. More resources consists of quality faculty devoted to student learning, a campus culture that promotes the free exchange and sharing of ideas and allows for innovation, opportunities for professional development, facilities, technology, and staff that promote and support student learning, extracurricular activities and cultural events that enhance the learning community, counseling and other advisory services.
Frequently Asked Questions
How much does City Colleges of Chicago-Wilbur Wright College cost?
City Colleges of Chicago-Wilbur Wright College's tuition is approximately $6,460 for In-State students and $7,891 for Out-State students.
What is the acceptance rate of City Colleges of Chicago-Wilbur Wright College?
The acceptance rate of City Colleges of Chicago-Wilbur Wright College is 33%, which is lower than the state average of 89%. City Colleges of Chicago-Wilbur Wright College's acceptance rate is ranked among the top community colleges in Illinois with low acceptance rates.
What is City Colleges of Chicago-Wilbur Wright College's ranking?
City Colleges of Chicago-Wilbur Wright College ranks among the top 20% of community college in Illinois for: Least expensive tuition, Lowest acceptance rates, Largest student body and Least debt for graduating students.
In what neighborhood is City Colleges of Chicago-Wilbur Wright College located?
City Colleges of Chicago-Wilbur Wright College is located in the Dunning neighborhood of Chicago, IL.
Recent Articles

Community College vs. Bootcamps for Tech Careers in 2026
Community college vs. bootcamps in 2026. Compare cost, outcomes, credentials, and hiring trends to choose the best tech career path.

How to Build a Class Schedule That Fits Your Life (Spring 2026)
Learn how to build a class schedule that fits your life with expert tips, updated strategies for Spring 2026, and practical planning tools for students and families.

Top 10 Jobs for Community College Graduates in 2026
Meta Description: Discover high-demand jobs for community college graduates, with current salary trends, costs, and career pathways.


