- The mission of Apollo College is to prepare graduates to become health care professionals with the knowledge and skill necessary to assume entry-level positions in the health care industry. Apollo College has the following goals consistent with its mission is to develop knowledgeable and skill-oriented graduates who possess the necessary behavior and attitude which allows them to transition into entry-level employment in the health care industry; to provide quality didactic and clinical experiences that prepare graduates to perform competently within the professional standards of their field of study; provide the appropriate educational environment and services that result in appropriate student completion and employment rates after graduation.
School Highlights
Carrington College-Portland serves 501 students (100% of students are full-time).
The college's student-teacher ratio of 31:1 is higher than the state community college average of 21:1.
Minority enrollment is 71% of the student body (majority Hispanic), which is more than the state average of 47%.
Quick Facts (2026)
- Enrollment: 501 students
- Acceptance Rate: 84%
- Student-teacher ratio: 31:1
- Minority enrollment: 71%
- Source: Integrated Postsecondary Education Data System (IPEDS)
Top Rankings
Carrington College-Portland ranks among the top 20% of public schools in Oregon for:
Category
Attribute
Selectivity
Diversity
School Resources
Debt For Students
School Overview
The teacher population of 16 teachers has stayed relatively flat over five years.
Carrington College-Portland
(OR) Community College Avg.
Carnegie Classification
Not applicable, not in Carnegie universe (not accredited or nondegree-granting)
Not applicable, not in Carnegie universe (not accredited or nondegree-granting)
Institution Level
Less than 2 years (below associate)
At least 2 but less than 4 years
Institution Control
Private for-profit
Private not-for-profit
Total Faculty
16 staff
192 staff
Number of Programs Offered
6
44
School Calendar
Student Body
The student population of Carrington College-Portland has grown by 51% over five years.
The student-teacher ratio of 31:1 has increased from 11:1 over five years.
The Carrington College-Portland diversity score of 0.72 is more than the state average of 0.66. The school's diversity has stayed relatively flat over five years.
Total Enrollment
501 students
2,463 students
Student-Teacher Ratio
31:1
21:1
# Full-Time Students
501 students
310 students
# Part-Time Students
73 students
2,153 students
# Enrollment Undergraduate
501 students
339 students
# Full-Time Undergraduate Students
501 students
310 students
# Full-Time Graduate Students
n/a
193 students
# Part-Time Undergraduate Students
73 students
2,589 students
# Part-Time Graduate Students
n/a
153 students
Total Dormitory Capacity
n/a
270 students
% American Indian/Alaskan
1%
1%
% Asian
3%
5%
% Hispanic
42%
20%
% Black
10%
3%
% White
29%
53%
% Hawaiian
3%
1%
% Two or more races
1%
5%
% Non Resident races
1%
1%
% Unknown races
10%
11%
Diversity Score
0.72
0.66
College Completion Rate (Students who graduate in less than 4 years)
62%
42%
College Completion Rate (Students who graduate in 4 years or more than 4 years)
n/a
58%
Average Graduate Earnings (10 Years)
$28,300
$33,800
Tuition and Acceptance Rate
% Students Receiving Some Financial Aid
99%
79%
Median Debt for Graduates
$8,926
$12,875
Median Debt for Dropouts
$5,473
$6,334
Acceptance Rate
84%
100%
Source: 2024 (or latest year available) Integrated Postsecondary Education Data System (IPEDS) , School Administrators
Frequently Asked Questions
What schools are Carrington College-Portland often compared to?
Carrington College-Portlandis often viewed alongside schools like Portland Community College by visitors of our site.
What is the acceptance rate of Carrington College-Portland?
The acceptance rate of Carrington College-Portland is 84%, which is lower than the state average of 100%. Carrington College-Portland's acceptance rate is ranked among the top community colleges in Oregon with low acceptance rates.
What is Carrington College-Portland's ranking?
Carrington College-Portland ranks among the top 20% of community college in Oregon for: Lowest acceptance rates, Diversity in US community colleges, Percent of students receiving financial aid and Least debt for graduating students.
In what neighborhood is Carrington College-Portland located?
Carrington College-Portland is located in the Northeast Portland neighborhood of Portland, OR.
Recent Articles

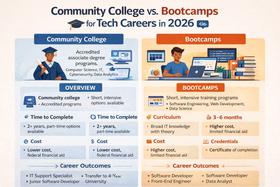
Community College vs. Bootcamps for Tech Careers in 2026
Community college vs. bootcamps in 2026. Compare cost, outcomes, credentials, and hiring trends to choose the best tech career path.

How to Build a Class Schedule That Fits Your Life (Spring 2026)
Learn how to build a class schedule that fits your life with expert tips, updated strategies for Spring 2026, and practical planning tools for students and families.

Top 10 Jobs for Community College Graduates in 2026
Meta Description: Discover high-demand jobs for community college graduates, with current salary trends, costs, and career pathways.


