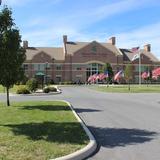
Lord Fairfax Community College

173 Skirmisher Lane
Middletown, VA 22645
Top Ranked (2023-24): View Rankings
  • Founded in 1970, Lord Fairfax Community College (LFCC) is a comprehensive, multi-campus public institution of higher education. Through its three locations - the Fauquier and Middletown Campuses and the Luray-Page County Center - the College serves eight localities in the Shenandoah Valley and Piedmont regions. The localities are the counties of Clarke, Fauquier, Frederick, Page, Rappahannock, Shenandoah and Warren and the city of Winchester.

School Highlights

Lord Fairfax Community College serves 6,337 students (30% of students are full-time).
The college's student:teacher ratio of 18:1 is higher than the state community college average of 17:1.
Minority enrollment is 20% of the student body (majority Hispanic), which is less than the state average of 48%.

Quick Stats (2023-24)

  • Enrollment: 6,337 students
  • In-state tuition: $4,199
  • Out-state tuition: $10,037
  • Student:teacher ratio: 18:1
  • Minority enrollment: 20%
  • Source: Integrated Postsecondary Education Data System (IPEDS)

Top Rankings

Lord Fairfax Community College ranks among the top 20% of public schools in Virginia for:

Category
Attribute
Community Size

School Overview

The teacher population of 352 teachers has grown by 70% over five years.
Lord Fairfax Community College
(VA) Community College Avg.
Carnegie Classification
Associates Colleges
Associates Colleges
Institution Level
At least 2 but less than 4 years
Institution Control
Public
Public
Total Faculty
352 staff
129 staff
This chart display total faculty of Lord Fairfax Community College and community college average number of faculty in VA by year, with the latest 2020-21 school year data.

Student Body

The student population of Lord Fairfax Community College has declined by 8% over five years.
The student:teacher ratio of 18:1 has decreased from 19:1 over five years.
The Lord Fairfax Community College diversity score of 0.35 is less than the state average of 0.66. The school's diversity has declined by 11% over five years.
Total Enrollment
6,337 students
2,086 students
This chart display the total enrollment of Lord Fairfax Community College and community college average number of enrollment of VA by year, with the latest 2020-21 school year data.
Student : Teacher Ratio
18:1
17:1
This chart display the student staff ratio of Lord Fairfax Community College and community college average student staff ratio of VA by year, with the latest 2020-21 school year data.
# Full-Time Students
1,889 students
843 students
This chart display the total number of Full-time students enrollment of Lord Fairfax Community College and average number of community college Full-time students enrollment of VA by year, with the latest 2020-21 school year data.
# Part-Time Students
4,448 students
1,243 students
This chart display the total number of Part-time students enrollment of Lord Fairfax Community College and average number of community college Part-time students enrollment of VA by year, with the latest 2020-21 school year data.
This chart display the Full-time students and Part-time students enrollment breakdown of Lord Fairfax Community College.
This chart display community college average Full-Time students and Part-Time students enrollment breakdown of VA.
# Enrollment Undergraduate
394 students
232 students
# Full-Time Undergraduate Students
1,889 students
802 students
This chart display the total number of Full-time undergraduate students enrollment of Lord Fairfax Community College and average number of community college Full-time undergraduate  students enrollment of VA by year, with the latest 2020-21 school year data.
# Full-Time Graduate Students
n/a
169 students
# Part-Time Undergraduate Students
4,448 students
1,243 students
# Part-Time Graduate Students
n/a
20 students
Total Dormitory Capacity
n/a
476 students
% American Indian/Alaskan
n/a
n/a
This chart display the percentage of American Indian/Alaskan students in Lord Fairfax Community College and the percentage of American Indian/Alaskan community college students in VA by year, with the latest 2009-10 school year data.
% Asian
2%
7%
This chart display the percentage of Asian students in Lord Fairfax Community College and the percentage of Asian community college students in VA by year, with the latest 2020-21 school year data.
% Hispanic
9%
12%
This chart display the percentage of Hispanic students in Lord Fairfax Community College and the percentage of Hispanic community college students in VA by year, with the latest 2020-21 school year data.
% Black
4%
21%
This chart display the percentage of Black students in Lord Fairfax Community College and the percentage of Black community college students in VA by year, with the latest 2020-21 school year data.
% White
80%
52%
This chart display the percentage of White students in Lord Fairfax Community College and the percentage of White community college students in VA by year, with the latest 2020-21 school year data.
% Hawaiian
n/a
n/a
This chart display the percentage of Hawaiian students in Lord Fairfax Community College and the percentage of Hawaiian community college students in VA by year, with the latest 2015-16 school year data.
% Two or more races
3%
4%
This chart display the percentage of Two or more races students in Lord Fairfax Community College and the percentage of Two or more races community college students in VA by year, with the latest 2020-21 school year data.
% Non Resident races
1%
2%
This chart display the percentage of Non Resident students in Lord Fairfax Community College and the percentage of Non Resident community college students in VA by year, with the latest 2020-21 school year data.
% Unknown races
2%
2%
This chart display the percentage breakdown of students of all ethnic groups in Lord Fairfax Community College.
This chart display the percentage breakdown of students of all ethnic groups in VA.
Diversity Score
0.35
0.66
This chart display the diversity score of Lord Fairfax Community College and the community college average diversity score of VA by year, with the latest 2020-21 school year data.
College Completion Rate (Students who graduate in less than 4 years)
43%
38%
This chart display completion rates for First-Time of Full-time students of Lord Fairfax Community College and community college average completion rates for First-Time of Full-time students of VA by year, with the latest 2020-21 school year data.
College Completion Rate (Students who graduate in 4 years or more than 4 years)
n/a
0.19%
Average Graduate Earnings (10 Years)
$35,700
$29,600
This chart display average graduate earnings (10 Years) of Lord Fairfax Community College and community college average graduate earnings (10 Years) of VA by year, disaggregated by student subgroups with the latest 2012-13 school year data.

Tuition and Acceptance Rate

The public in-state tuition of $4,199 is more than the state average of $3,736. The in-state tuition has declined by 9% over four years.
The public out-state tuition of $10,037 is more than the state average of $8,977. The out-state tuition has stayed relatively flat over four years.
In-State Tuition Fees
$4,199
$3,736
This chart display tuition fees for an in-state student of Lord Fairfax Community College and the public community college average tuition fees for an in-state student of VA by year, with the latest 2020-21 school year data.
Out-State Tuition Fees
$10,037
$8,977
This chart display tuition fees for an out-of-state student of Lord Fairfax Community College and the public community college average tuition fees for an out-of-state student of VA by year, with the latest 2020-21 school year data.
% Students Receiving Some Financial Aid
63%
85%
This chart display the percent of students who is receiving some financial aid in Lord Fairfax Community College and the percent of community college students who is receiving some financial aid in VA by year, with the latest 2020-21 school year data.
Median Debt for Graduates
$9,750
$11,000
This chart display median debt for students who have completed a certificate or degree in Lord Fairfax Community College and average median debt for community college students who have completed a certificate or degree in VA by year, with the latest 2020-21 school year data.
Median Debt for Dropouts
$5,500
$5,500
This chart display median debt for students who have not completed a certificate or degree in Lord Fairfax Community College and average median debt for community college students who have not completed a certificate or degree in VA by year, with the latest 2020-21 school year data.
Acceptance Rate
n/a
71%
Source: 2021 (or latest year available) Integrated Postsecondary Education Data System (IPEDS) , School Administrators

School Notes

  • LFCC offers more than 75 associate degree and certificate programs in a wide variety of disciplines, in addition to providing access to bachelor's, master's and doctoral degree programs offered on site by a four-year institution. LFCC also serves the business community by offering workforce preparation programs for employees and employers. LFCC serves more than 7,600 unduplicated credit students and more than 10,450 individuals in professional development and business and industry courses annually. LFCC offers low tuition rates that are approximately one-third the cost of attending a four-year institution in Virginia. In addition, the College offers students flexible scheduling options with day, evening, weekend and Internet courses. LFCC has established numerous transfer/articulation agreements with four-year colleges and universities in Virginia, enabling a smooth transition from LFCC to other institutions. Lord Fairfax Community College is accredited by the Commission on Colleges of the Southern Association of Colleges and Schools to award associate degrees. Contact the Commission on Colleges at 1866 Southern Lane, Decatur, Georgia 30033-4097 or call 404-679-4500 for questions about the accreditation of Lord Fairfax Community College.

Frequently Asked Questions

How much does Lord Fairfax Community College cost?
Lord Fairfax Community College's tuition is approximately $4,199 for In-State students and $10,037 for Out-State students.
What is Lord Fairfax Community College's ranking?
Lord Fairfax Community College ranks among the top 20% of community college in Virginia for: Largest student body.

Recent Articles

How to Take Online Community College Classes for Free
Learn about programs across the country that allow students to take online community college classes for free.
A Nontraditional Student’s Guide to Community College
Going to college is hard work but it’s even more challenging for nontraditional students who are working or raising a family at the same time. If you’re considering community college to improve your life or further your career, here’s everything you need to know.
Beyond the High School Classroom: The Pros and Cons of Dual Enrollment
Explore the intricacies of dual enrollment, a growing educational trend that allows high school students to earn college credits. This comprehensive guide delves into its history, eligibility requirements, benefits, and drawbacks, offering valuable insights for both parents and students considering this path.

Quick Stats (2023-24)

  • Enrollment: 6,337 students
  • In-state tuition: $4,199
  • Out-state tuition: $10,037
  • Student:teacher ratio: 18:1
  • Minority enrollment: 20%
  • Source: Integrated Postsecondary Education Data System (IPEDS)

Related School Videos

Did You Know?

For Virginia public community colleges, the average tuition is approximately $3,736 per year for in-state students and $8,977 for out-of-state students. For private community colleges, the average yearly tuition is approximately $15,561 per year. Read more about average community college tuition costs across the country.

The average community college acceptance rate in Virginia is 77%. Read more about national community college acceptance rates.

Virginia community colleges have a diversity score of 0.66, which is lower than the national average of 0.70. The most diverse community college in Virginia is American National University. Read more about community college diversity statistics in the USA.

Quick Links