Lake Superior College

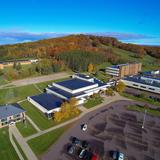
  • Lake Superior College (LSC) provides high quality, affordable higher education that benefits diverse learners, employers, and the community. LSC's academic, technical, continuing education, and workforce development offerings prepare learners for a rapidly changing global community. Our services support learning, and our partnerships connect the college and its learners to a broader spectrum of community life.

School Highlights

Lake Superior College serves 4,074 students (35% of students are full-time).
The college's student-teacher ratio of 38:1 is higher than the state community college average of 36:1.
Minority enrollment is 21% of the student body (majority Hispanic and Black), which is less than the state average of 43%.

Quick Facts (26-27)

  • Enrollment: 4,074 students
  • In-state tuition: $5,107
  • Out-state tuition: $9,524
  • Acceptance Rate: 75%
  • Student-teacher ratio: 38:1
  • Minority enrollment: 21%
  • Source: Integrated Postsecondary Education Data System (IPEDS)

School Overview

The teacher population of 106 teachers has declined by 58% over five years.
Lake Superior College
(MN) Community College Avg.
Carnegie Classification
Associate's Colleges
Institution Level
At least 2 but less than 4 years
Institution Control
Public
Public
Total Faculty
106 staff
94 staff
School Calendar

Student Body

The student population of Lake Superior College has declined by 14% over five years.
The student-teacher ratio of 38:1 has increased from 20:1 over five years.
The Lake Superior College diversity score of 0.37 is less than the state average of 0.63. The school's diversity has grown by 34% over five years.
Total Enrollment
4,074 students
2,882 students

Showing 2012–2025. Full 19-year historical data available below ↓

Student-Teacher Ratio
38:1
36:1

Showing 2008–2025. Full 19-year historical data available below ↓

# Full-Time Students
1,430 students
1,168 students

Showing 2013–2025. Full 19-year historical data available below ↓

# Part-Time Students
2,644 students
1,714 students

Showing 2013–2025. Full 19-year historical data available below ↓

# Enrollment Undergraduate
4,074 students
2,681 students
# Full-Time Undergraduate Students
1,430 students
1,143 students

Showing 2013–2025. Full 19-year historical data available below ↓

# Part-Time Undergraduate Students
2,644 students
1,714 students
% American Indian/Alaskan
2%
1%

Showing 2011–2025. Full 19-year historical data available below ↓

% Asian
2%
6%

Showing 2008–2025. Full 19-year historical data available below ↓

% Hispanic
4%
8%

Showing 2010–2025. Full 19-year historical data available below ↓

% Black
3%
16%

Showing 2010–2025. Full 19-year historical data available below ↓

% White
79%
57%

Showing 2010–2025. Full 19-year historical data available below ↓

% Two or more races
5%
4%
% Non Resident races
1%
1%
% Unknown races
4%
7%
Diversity Score
0.37
0.63

Showing 2011–2025. Full 19-year historical data available below ↓

College Completion Rate (Students who graduate in less than 4 years)
34%
34%

Showing 2015–2025. Full 19-year historical data available below ↓

Average Graduate Earnings (10 Years)
$36,700
$37,000

Tuition & Financial Aid

The public in-state tuition of $5,107 is less than the state average of $5,573. The in-state tuition has declined by 9% over four years.
The public out-state tuition of $9,524 is more than the state average of $6,083. The out-state tuition has grown by 69% over four years.
In-State Tuition Fees
$5,107
$5,573

Showing 2008–2025. Full 19-year historical data available below ↓

Out-State Tuition Fees
$9,524
$6,083
Tuition Notes
per year based on 15
% Students Receiving Some Financial Aid
76%
87%

Showing 2012–2025. Full 19-year historical data available below ↓

Median Debt for Graduates
$13,000
$12,750

Showing 2008–2020. Full 14-year historical data available below ↓

Median Debt for Dropouts
$6,332
$6,752

Showing 2008–2020. Full 14-year historical data available below ↓

Acceptance Rate
75%
90%
Source: 2025 (or latest year available) Integrated Postsecondary Education Data System (IPEDS) , School Administrators

School Notes

  • Lake Superior College is a dynamic, comprehensive college serving the needs of a variety of students, one which emphasizes student learning and student service. LSC offers extensive pre-baccalaureate majors for students interested in transferring to senior educational institutions as well as over 75 certificate, diploma and degree programs in career/technical fields. Our Continuing Education/Customized Training division collaborates extensively with area businesses and industry to design specialized opportunities for entry-level and advanced education. While typically offered in traditional classroom and lab settings, LSC also offers over 150 courses in an individualized learning format, through interactive television, and through the internet. You will find the faculty and staff at Lake Superior College to be friendly, sincere, and helpful. We are student-centered, creative, and dedicated to working with students within dynamic learning environments, and we take pride in our commitment to helping students succeed. Approximately 4,500 students attend LSC. We have many local, national, and international students. With the rate of internet classes on the rise, we have many students who are attending LSC from several countries around the world.

Frequently Asked Questions

How much does Lake Superior College cost?
Lake Superior College's tuition is approximately $5,107 for In-State students and $9,524 for Out-State students.
What is the acceptance rate of Lake Superior College?
The acceptance rate of Lake Superior College is 75%, which is lower than the state average of 90%.
In what neighborhood is Lake Superior College located?
Lake Superior College is located in the Piedmont Heights neighborhood of Duluth, MN.

Recent Articles

Will Your Community College GPA Follow You After Transfer?
Will your community college GPA follow you after transfer? Learn how university grades, transcripts, scholarships, graduate admissions, and academic standing may be affected by your previous college performance.
The Transfer Catalog-Year Trap: What Students Must Check
Could university requirements change before you transfer? Learn how catalog years, continuous enrollment, and degree rules affect your pathway, and what students should verify before choosing university courses.
Transfer Agreements: Admission vs. Your Major
Does your transfer agreement guarantee admission to your major? Discover what happens when universities accept transfer students but restrict entry to specific academic programs and degrees after admission.

Quick Facts (26-27)

  • Enrollment: 4,074 students
  • In-state tuition: $5,107
  • Out-state tuition: $9,524
  • Acceptance Rate: 75%
  • Student-teacher ratio: 38:1
  • Minority enrollment: 21%
  • Source: Integrated Postsecondary Education Data System (IPEDS)

Related School Videos

Quick Links