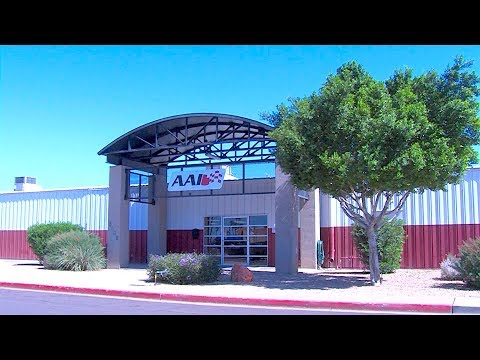
Miller-Motte College-Arizona Automotive Institute

School Highlights

Miller-Motte College-Arizona Automotive Institute serves 689 students (100% of students are full-time).
The college's student-teacher ratio of 24:1 is lower than the state community college average of 36:1.
Minority enrollment is 75% of the student body (majority Hispanic), which is more than the state average of 60%.

Quick Facts (26-27)

  • Enrollment: 689 students
  • Student-teacher ratio: 24:1
  • Minority enrollment: 75%
  • Source: Integrated Postsecondary Education Data System (IPEDS)

School Overview

The teacher population of 29 teachers has declined by 45% over five years.
Miller-Motte College-Arizona Automotive Institute
(AZ) Community College Avg.
Carnegie Classification
Not applicable, not in Carnegie universe (not accredited or nondegree-granting)
Associate's Colleges
Institution Level
At least 2 but less than 4 years
Institution Control
Private for-profit
Private, for profit
Year Founded
1968
Total Faculty
29 staff
64 staff
Number of Programs Offered
7
10
AccreditationAccred.
Accrediting Commission of Career Schools and Colleges (ACCSC)

Student Body

The student population of Miller-Motte College-Arizona Automotive Institute has grown by 87% over five years.
The student-teacher ratio of 24:1 has increased from 9:1 over five years.
The Miller-Motte College-Arizona Automotive Institute diversity score of 0.68 is less than the state average of 0.69. The school's diversity has declined by 7% over five years.
Total Enrollment
689 students
3,480 students

Showing 2012–2025. View full 19-year historical data

Student-Teacher Ratio
24:1
36:1
# Full-Time Students
689 students
941 students

Showing 2012–2025. View full 19-year historical data

# Part-Time Students
1 students
2,539 students
# Enrollment Undergraduate
689 students
1,687 students
# Full-Time Undergraduate Students
689 students
941 students

Showing 2012–2025. View full 19-year historical data

% American Indian/Alaskan
10%
3%

Showing 2008–2025. View full 19-year historical data

% Asian
1%
4%
% Hispanic
48%
37%

Showing 2011–2025. View full 19-year historical data

% Black
11%
6%

Showing 2008–2025. View full 19-year historical data

% White
25%
40%

Showing 2010–2025. View full 19-year historical data

% Two or more races
5%
5%
Diversity Score
0.68
0.69

Showing 2011–2025. View full 19-year historical data

College Completion Rate (Students who graduate in less than 4 years)
53%
39%

Showing 2015–2025. View full 19-year historical data

Median Earnings 10 Years After Entry (measured in 2022-2023, in 2024 dollars)
$34,579
$44,191

Points are in the dollars of their own College Scorecard release, and the colleges behind the state line differ by period. The lines do not show inflation-adjusted growth.

Tuition & Financial Aid

% Students Receiving Some Financial Aid
87%
78%

Showing 2013–2025. View full 19-year historical data

Median Debt for Graduates
$14,000
$9,500

Showing 2008–2020. View full 14-year historical data

Median Debt for Dropouts
$6,334
$4,750

Showing 2008–2020. View full 14-year historical data

Source: 2025 (or latest year available) Integrated Postsecondary Education Data System (IPEDS)

Recent Articles

Does a College’s Employer Partnership Include Hiring?
A major employer’s logo does not promise a job. Learn how to check hiring commitments, eligibility and access before choosing a community college program.
New vs. Established Career Programs: Which Is Safer?
Compare new and established community college career programs by checking readiness, recent outcomes, staffing and support before you commit to enrollment.
Can Your Career Credential Cross State Lines?
Before choosing a community college career program, check whether its credential meets licensing requirements in another state and what moving could cost.

Quick Facts (26-27)

  • Enrollment: 689 students
  • Student-teacher ratio: 24:1
  • Minority enrollment: 75%
  • Source: Integrated Postsecondary Education Data System (IPEDS)

Related School Videos

Did You Know?

The average community college acceptance rate in Maricopa County, AZ is 92%. Read more about national community college acceptance rates.

Maricopa County, AZ community colleges have a diversity score of 0.69, which is lower than the national average of 0.74. The most diverse community college in Maricopa County, AZ is Brookline College-Phoenix. Read more about community college diversity statistics in the USA.

Quick Links