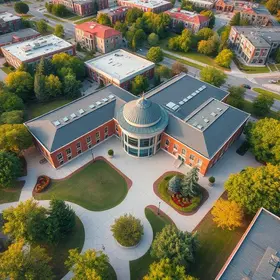
Riverside College of Health Careers serves 410 students (89% of students are full-time).
Minority enrollment is 41% of the student body (majority Black), which is less than the state average of 55%.
Quick Facts (26-27)
Enrollment: 410 students
Minority enrollment: 41%
Source: Integrated Postsecondary Education Data System (IPEDS)
School Overview
Riverside College of Health Careers
(VA) Community College Avg.
Carnegie Classification
Special Focus Two-Year: Health Professions
Associate's Colleges
Institution Level
Four or more years
At least 2 but less than 4 years
Institution Control
Private not-for-profit
Private, non-profit
AccreditationAccred.
Accrediting Bureau of Health Education Schools (ABHES)
Student Body
The student population of Riverside College of Health Careers has grown by 33% over five years.
The Riverside College of Health Careers diversity score of 0.58 is less than the state average of 0.72. The school's diversity has grown by 41% over five years.
Note: Data may not be displayed on any public-facing website or service that replicates or resembles a college search or review portal without prior written permission. See our Terms of Service.
Note: Data may not be displayed on any public-facing website or service that replicates or resembles a college search or review portal without prior written permission. See our Terms of Service.
Note: Data may not be displayed on any public-facing website or service that replicates or resembles a college search or review portal without prior written permission. See our Terms of Service.
Note: Data may not be displayed on any public-facing website or service that replicates or resembles a college search or review portal without prior written permission. See our Terms of Service.
Note: Data may not be displayed on any public-facing website or service that replicates or resembles a college search or review portal without prior written permission. See our Terms of Service.
Note: Data may not be displayed on any public-facing website or service that replicates or resembles a college search or review portal without prior written permission. See our Terms of Service.
Note: Data may not be displayed on any public-facing website or service that replicates or resembles a college search or review portal without prior written permission. See our Terms of Service.
Note: Data may not be displayed on any public-facing website or service that replicates or resembles a college search or review portal without prior written permission. See our Terms of Service.
Note: Data may not be displayed on any public-facing website or service that replicates or resembles a college search or review portal without prior written permission. See our Terms of Service.
Note: Data may not be displayed on any public-facing website or service that replicates or resembles a college search or review portal without prior written permission. See our Terms of Service.
Note: Data may not be displayed on any public-facing website or service that replicates or resembles a college search or review portal without prior written permission. See our Terms of Service.
College Completion Rate (Students who graduate in less than 4 years)
Note: Data may not be displayed on any public-facing website or service that replicates or resembles a college search or review portal without prior written permission. See our Terms of Service.
College Completion Rate (Students who graduate in 4 years or more than 4 years)
Note: Data may not be displayed on any public-facing website or service that replicates or resembles a college search or review portal without prior written permission. See our Terms of Service.
Note: Data may not be displayed on any public-facing website or service that replicates or resembles a college search or review portal without prior written permission. See our Terms of Service.
Note: Data may not be displayed on any public-facing website or service that replicates or resembles a college search or review portal without prior written permission. See our Terms of Service.
Note: Data may not be displayed on any public-facing website or service that replicates or resembles a college search or review portal without prior written permission. See our Terms of Service.
Source: 2025 (or latest year available) Integrated Postsecondary Education Data System (IPEDS)
Learn how to evaluate licensure pass rates before enrolling in community college career programs, compare exam results, identify warning signs, and choose training that supports professional licensing and employment goals.
A college course may transfer without counting toward your major. Learn how to check degree requirements, identify elective credits, avoid graduation delays, and protect your community college transfer plan.
Should you transfer with 45 credits, 60 credits, or an associate degree? Compare university requirements, tuition savings, graduation timelines, and transfer benefits to choose the best path for your goals.
Quick Facts (26-27)
Enrollment: 410 students
Minority enrollment: 41%
Source: Integrated Postsecondary Education Data System (IPEDS)
For Virginia public community colleges, the average tuition is approximately $3,581 per year for in-state students and $8,577 for out-of-state students. For private community colleges, the average yearly tuition is approximately $15,536 per year. Read more about average community college tuition costs across the country.