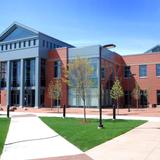
Lincoln College of New England-Southington (Closed 2020)

2279 Mount Vernon Road
Southington, CT 06489
  • Briarwood College is a private, coeducational residential college that fosters a student-centered philosophy and commitment to lifelong learning. The mission of the College is to provide students with a quality education that promotes the importance of liberal education, the need for critical thinking, good communication skills, a strong work ethic and success in their chosen careers. The College encourages each student to achieve self-worth and confidence, self-discipline, and responsible citizenship in a culturally diverse environment. Briarwood College advocates active student outreach and service to others in local and global communities.

School Highlights

Lincoln College of New England-Southington served 715 students (63% of students were full-time).
The college's student:teacher ratio of 10:1 was lower than the state community college average of 12:1.
Minority enrollment was 42% of the student body (majority Black), which was less than the state average of 47%.

School Overview

Lincoln College of New England-Southington
(CT) Community College Avg.
Carnegie Classification
Associates Colleges
Associates Colleges
Institution Level
Four or more years
At least 2 but less than 4 years
Institution Control
Private, for profit
Public
Total Faculty
71 staff
154 staff
This chart displays total faculty of Lincoln College of New England-Southington and community college average number of faculty in Connecticut by year, with the latest 2019-20 school year data.

Student Body

Total Enrollment
715 students
2,094 students
This chart displays the total enrollment of Lincoln College of New England-Southington and community college average number of enrollment of Connecticut by year, with the latest 2019-20 school year data.
Student : Teacher Ratio
10:1
12:1
This chart displays the student staff ratio of Lincoln College of New England-Southington and community college average student staff ratio of Connecticut by year, with the latest 2019-20 school year data.
# Full-Time Students
451 students
789 students
This chart displays the total number of Full-time students enrollment of Lincoln College of New England-Southington and average number of community college Full-time students enrollment of Connecticut by year, with the latest 2019-20 school year data.
# Part-Time Students
264 students
1,305 students
This chart displays the total number of Part-time students enrollment of Lincoln College of New England-Southington and average number of community college Part-time students enrollment of Connecticut by year, with the latest 2019-20 school year data.
This chart displays the Full-time students and Part-time students enrollment breakdown of Lincoln College of New England-Southington.
This chart displays community college average Full-Time students and Part-Time students enrollment breakdown of Connecticut.
# Enrollment Undergraduate
594 students
318 students
# Full-Time Undergraduate Students
451 students
789 students
This chart displays the total number of Full-time undergraduate students enrollment of Lincoln College of New England-Southington and average number of community college Full-time undergraduate  students enrollment of Connecticut by year, with the latest 2019-20 school year data.
# Full-Time Graduate Students
n/a
13 students
# Part-Time Undergraduate Students
264 students
2,023 students
# Part-Time Graduate Students
n/a
86 students
Total Dormitory Capacity
204 students
80 students
This chart displays the dormitory capacity of Lincoln College of New England-Southington and the community college average dormitory capacity of Connecticut by year, with the latest 2019-20 school year data.
% Asian
1%
4%
This chart displays the percentage of Asian students in Lincoln College of New England-Southington and the percentage of Asian community college students in Connecticut by year, with the latest 2019-20 school year data.
% Hispanic
9%
21%
This chart displays the percentage of Hispanic students in Lincoln College of New England-Southington and the percentage of Hispanic community college students in Connecticut by year, with the latest 2019-20 school year data.
% Black
17%
14%
This chart displays the percentage of Black students in Lincoln College of New England-Southington and the percentage of Black community college students in Connecticut by year, with the latest 2019-20 school year data.
% White
58%
53%
This chart displays the percentage of White students in Lincoln College of New England-Southington and the percentage of White community college students in Connecticut by year, with the latest 2019-20 school year data.
% Two or more races
3%
2%
This chart displays the percentage of Two or more races students in Lincoln College of New England-Southington and the percentage of Two or more races community college students in Connecticut by year, with the latest 2019-20 school year data.
% Non Resident races
1%
2%
This chart displays the percentage of Non Resident students in Lincoln College of New England-Southington and the percentage of Non Resident community college students in Connecticut by year, with the latest 2019-20 school year data.
% Unknown races
11%
4%
This chart displays the percentage breakdown of students of all ethnic groups in Lincoln College of New England-Southington.
This chart displays the percentage breakdown of students of all ethnic groups in Connecticut.
Diversity Score
0.61
0.65
This chart displays the diversity score of Lincoln College of New England-Southington and the community college average diversity score of Connecticut by year, with the latest 2019-20 school year data.
College Completion Rate (Students who graduate in less than 4 years)
n/a
16%
College Completion Rate (Students who graduate in 4 years or more than 4 years)
n/a
1.38%
Average Graduate Earnings (10 Years)
$35,300
$34,800
This chart displays average graduate earnings (10 Years) of Lincoln College of New England-Southington and community college average graduate earnings (10 Years) of Connecticut by year, disaggregated by student subgroups with the latest 2012-13 school year data.

Tuition and Acceptance Rate

Private State Tuition Fees
$19,940
$21,887
This chart displays tuition fees for an in-state student of Lincoln College of New England-Southington and the private community college average tuition fees for an in-state student of Connecticut by year, with the latest 2019-20 school year data.
% Students Receiving Some Financial Aid
95%
74%
This chart displays the percent of students who is receiving some financial aid in Lincoln College of New England-Southington and the percent of community college students who is receiving some financial aid in Connecticut by year, with the latest 2019-20 school year data.
Median Debt for Graduates
$25,135
$5,500
This chart displays median debt for students who have completed a certificate or degree in Lincoln College of New England-Southington and average median debt for community college students who have completed a certificate or degree in Connecticut by year, with the latest 2014-15 school year data.
Median Debt for Dropouts
$9,398
$4,400
This chart displays median debt for students who have not completed a certificate or degree in Lincoln College of New England-Southington and average median debt for community college students who have not completed a certificate or degree in Connecticut by year, with the latest 2014-15 school year data.
Acceptance Rate
n/a
91%
SAT Reading
n/a
500
SAT Math
n/a
510
ACT Composite
n/a
23
Source: 2020 (or latest year available) Integrated Postsecondary Education Data System (IPEDS) , School Administrators

School Notes

  • Founded in 1966 as the Briarwood Secretarial School, the institution became Briarwood College in 1979. It is accredited by the New England Association of Schools and Colleges and the State of Connecticut Board of Governors for Higher Education. Briarwood's 43-acre campus, nestled at the base of Mount Southington, is approximately 20 miles from downtown Hartford, and is easily accessible to Bradley International Airport. The campus setting, while minutes away from the town and Interstate I-84, projects a picturesque and spacious quality. It is only a few miles from Queen Street, a major local thoroughfare offering numerous shops, restaurants, and services. Nearby is a popular amusement park, Lake Compounce, as well as an 18-hole golf course, fitness center, the Mount Southington ski area, and the headquarters of ESPN, the world leader in sports broadcasting. Our curriculum is structured and scheduled to encourage and facilitate lifelong learning. We offer part-time opportunities, evening classes, on-line courses, an accelerated Saturday College Flex Express option designed for working adults, and a variety of continuing education offerings through our Division of Lifelong Learning. Pool Tournaments, movie nights, International Day, club events, Gold's Gym workouts, holiday festivities and monthly calendars full of on-campus and off-campus activities keep students busy throughout the year.

Frequently Asked Questions

How much does Lincoln College of New England-Southington cost?
Lincoln College of New England-Southington's private state tuition is approximately $19,940.

Recent Articles

Retaining Students through Innovation
Community colleges are heeding President Obama's call for student retention. Learn about the innovative programs some community campuses are creating that keep students in their classroom seats.
Community Colleges Fight Back Against For-Profit Attacks: The Rebuttal
After being attacked by private colleges, community colleges are mounting a defense and publishing studies that clearly outline the differences between the public and private institutions.
A to Z of Community College Certificates and Courses
June 17, 2024
A to Z of Community College Certificates and Courses
From business and healthcare to technology and skilled trades, the article showcases the breadth of options available to students seeking to enhance their knowledge, develop new skills, or pursue career advancement.

Did You Know?

Hartford County, CT community colleges have a diversity score of 0.60, which is lower than the national average of 0.71. The most diverse community college in Hartford County, CT is Capital Community College. Read more about community college diversity statistics in the USA.

Quick Links