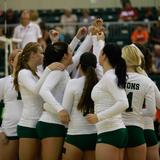
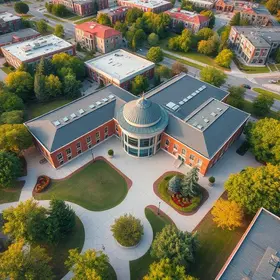
Fort Peck Community College serves 362 students (54% of students are full-time).
The college's student-teacher ratio of 16:1 is lower than the state community college average of 23:1.
Minority enrollment is 79% of the student body (majority American), which is more than the state average of 44%.
Quick Facts (26-27)
Enrollment: 362 students
Student-teacher ratio: 16:1
Minority enrollment: 79%
Source: Integrated Postsecondary Education Data System (IPEDS)
School Overview
The teacher population of 22 teachers has declined by 52% over five years.
Fort Peck Community College
(MT) Community College Avg.
Carnegie Classification
Tribal colleges and universities
Associate's Colleges
Institution Level
At least 2 but less than 4 years
At least 2 but less than 4 years
Institution Control
Public
Public
Year Founded
1978
Total Faculty
22 staff
33 staff
Student Body
The student population of Fort Peck Community College has stayed relatively flat over five years.
The student-teacher ratio of 16:1 has increased from 8:1 over five years.
The Fort Peck Community College diversity score of 0.38 is less than the state average of 0.61. The school's diversity has grown by 86% over five years.
Note: Data may not be displayed on any public-facing website or service that replicates or resembles a college search or review portal without prior written permission. See our Terms of Service.
Note: Data may not be displayed on any public-facing website or service that replicates or resembles a college search or review portal without prior written permission. See our Terms of Service.
Note: Data may not be displayed on any public-facing website or service that replicates or resembles a college search or review portal without prior written permission. See our Terms of Service.
Note: Data may not be displayed on any public-facing website or service that replicates or resembles a college search or review portal without prior written permission. See our Terms of Service.
Note: Data may not be displayed on any public-facing website or service that replicates or resembles a college search or review portal without prior written permission. See our Terms of Service.
Note: Data may not be displayed on any public-facing website or service that replicates or resembles a college search or review portal without prior written permission. See our Terms of Service.
Note: Data may not be displayed on any public-facing website or service that replicates or resembles a college search or review portal without prior written permission. See our Terms of Service.
Note: Data may not be displayed on any public-facing website or service that replicates or resembles a college search or review portal without prior written permission. See our Terms of Service.
Note: Data may not be displayed on any public-facing website or service that replicates or resembles a college search or review portal without prior written permission. See our Terms of Service.
Note: Data may not be displayed on any public-facing website or service that replicates or resembles a college search or review portal without prior written permission. See our Terms of Service.
College Completion Rate (Students who graduate in less than 4 years)
Note: Data may not be displayed on any public-facing website or service that replicates or resembles a college search or review portal without prior written permission. See our Terms of Service.
Median Earnings 10 Years After Entry (measured in 2022-2023, in 2024 dollars)
Points are in the dollars of their own College Scorecard release, and the colleges behind the state line differ by period. The lines do not show inflation-adjusted growth.
Median Earnings 10 Years After Entry Trends (2008-2023)
Note: Data may not be displayed on any public-facing website or service that replicates or resembles a college search or review portal without prior written permission. See our Terms of Service.
Note: Data may not be displayed on any public-facing website or service that replicates or resembles a college search or review portal without prior written permission. See our Terms of Service.
Source: 2025 (or latest year available) Integrated Postsecondary Education Data System (IPEDS)
Nearby Schools
The nearest community college to Fort Peck Community College is Williston State College (73.0 miles away)
Short-term training has more funding options, but speed is only one consideration. Compare immediate job preparation with documented degree pathways, remaining coursework, future costs, and realistic plans for returning.
New investment is expanding technical training, but funding alone should not determine your major. Learn how to evaluate funded programs, student access, career fit, and benefits for your entering class.
A community college program tied to one major employer can offer valuable training. Learn how to weigh specialized skills, local job dependence, and your options if that employer changes course.
Quick Facts (26-27)
Enrollment: 362 students
Student-teacher ratio: 16:1
Minority enrollment: 79%
Source: Integrated Postsecondary Education Data System (IPEDS)