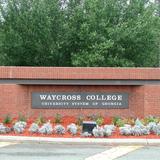
- The academic programs at Okefenokee Technical College are designed to provide the opportunity to develop academic knowledge, skills, and attitudes necessary to secure personally satisfying, rewarding, and socially useful employment. All programs of study comply with Technical College System of Georgia (TCSG) approved curriculum reflecting current, up-to-date knowledge and skills training. TCC programs provide a structured sequence of credit courses that will enable individuals to either be employed in an entry-level position or to increase job proficiencies.
School Highlights
Coastal Pines Technical College serves 5,433 students (15% of students are full-time).
The college's student-teacher ratio of 22:1 is higher than the state community college average of 18:1.
Minority enrollment is 38% of the student body (majority Black), which is less than the state average of 61%.
Quick Facts (2026)
- Enrollment: 5,433 students
- Student-teacher ratio: 22:1
- Minority enrollment: 38%
- Source: Integrated Postsecondary Education Data System (IPEDS)
School Overview
The teacher population of 244 teachers has stayed relatively flat over five years.
Coastal Pines Technical College
(GA) Community College Avg.
Carnegie Classification
Associate's Colleges: High Career & Technical-High Nontraditional
Associates--Public Rural-serving Medium
Institution Level
Less than 2 yrs
At least 2 but less than 4 years
Institution Control
Public
Public
Total Faculty
244 staff
209 staff
School Calendar
Student Body
The student population of Coastal Pines Technical College has grown by 50% over five years.
The student-teacher ratio of 22:1 has increased from 15:1 over five years.
The Coastal Pines Technical College diversity score of 0.55 is less than the state average of 0.71. The school's diversity has grown by 36% over five years.
Total Enrollment
5,433 students
2,604 students
Student-Teacher Ratio
22:1
18:1
# Full-Time Students
802 students
882 students
# Part-Time Students
4,631 students
1,722 students
# Enrollment Undergraduate
543 students
299 students
# Full-Time Undergraduate Students
802 students
929 students
# Full-Time Graduate Students
n/a
87 students
# Part-Time Undergraduate Students
n/a
1,848 students
# Part-Time Graduate Students
n/a
53 students
Total Dormitory Capacity
n/a
654 students
% Asian
1%
4%
% Hispanic
11%
10%
% Black
22%
35%
% White
62%
39%
% Hawaiian
n/a
1%
% Two or more races
4%
3%
% Non Resident races
n/a
1%
% Unknown races
n/a
7%
Diversity Score
0.55
0.71
College Completion Rate (Students who graduate in less than 4 years)
50%
43%
College Completion Rate (Students who graduate in 4 years or more than 4 years)
n/a
24%
Average Graduate Earnings (10 Years)
$25,500
$29,500
Tuition and Acceptance Rate
% Students Receiving Some Financial Aid
88%
93%
Median Debt for Graduates
n/a
$12,139
Median Debt for Dropouts
n/a
$5,500
Acceptance Rate
n/a
75%
SAT Reading
n/a
465
SAT Math
n/a
450
SAT Writing
n/a
465
ACT Composite
n/a
18
ACT English
n/a
18
ACT Math
n/a
18
ACT Writing
n/a
7
Source: 2023 (or latest year available) Integrated Postsecondary Education Data System (IPEDS)
Recent Articles

Most In-Demand Community College Majors for 2025–26
Explore the most in-demand community college majors for 2025–26 workforce needs, aligned with hiring trends, wages, and transfer pathways.

New Guidebook Helps Students Navigate Community College
A new guidebook offers practical strategies to help students and families succeed in community college, from admissions to transfer and career planning.

Work-Study Opportunities for Spring 2026 Guide
Learn how to secure work-study opportunities for Spring 2026 before classes start, including timelines, tips, and eligibility guidance.


