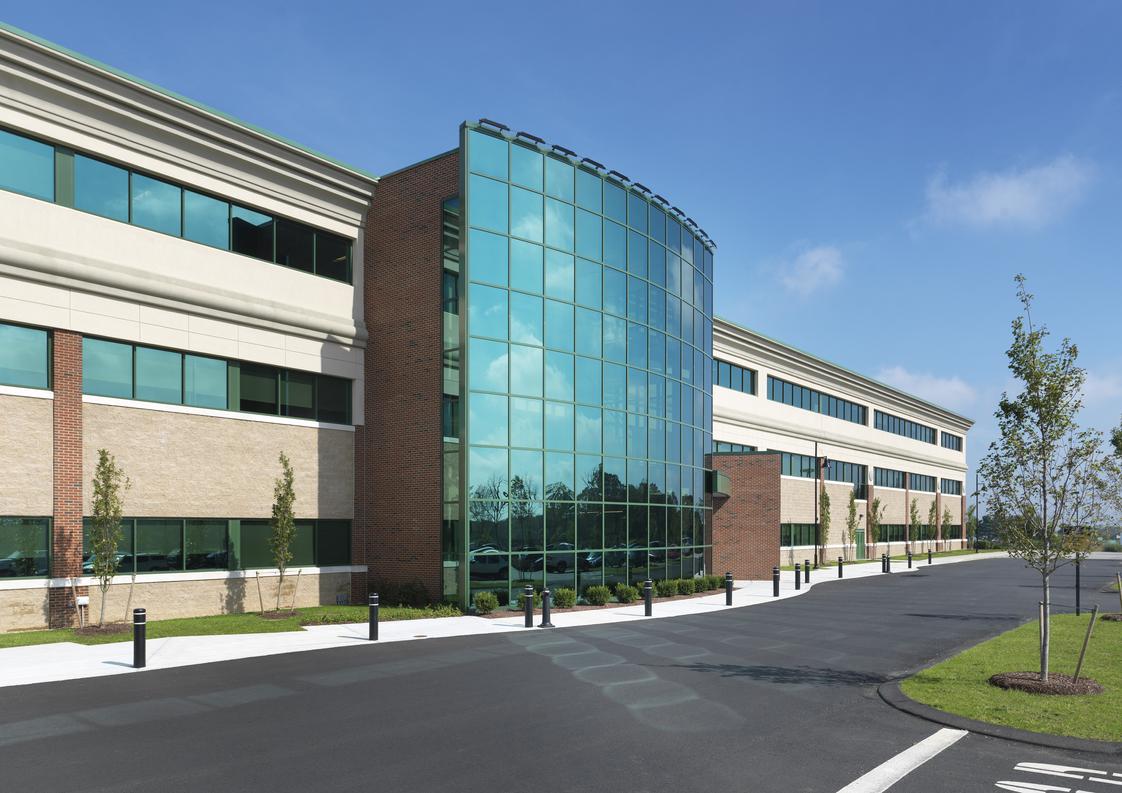
The mission of New England Institute of Technology (NEIT) is to provide Associate's, Bachelor's, and Graduate, degree programs which prepare students for professional and technical careers. Through the combination of professional and technical courses and an integrated liberal arts core, academic programs emphasize the relevance of continuous learning to personal and professional growth. Upon successful completion, graduates are prepared to enter the workforce or to continue their education. As an extension of the primary mission, NEIT offers the opportunity to pursue professional and technological studies to satisfy personal interests. As an institution primarily devoted to teaching, NEIT provides opportunities for students from diverse educational backgrounds and with varying levels of ability to study in a variety of technological fields.
School Highlights
New England Institute of Technology serves 1,922 students (91% of students are full-time).
The college's student-teacher ratio of 13:1 is lower than the state community college average of 26:1.
Minority enrollment is 49% of the student body (majority Hispanic), which is less than the state average of 54%.
Quick Facts (2026)
Enrollment: 1,922 students
Private-state tuition: $30,000
Acceptance Rate: 67%
Student-teacher ratio: 13:1
Minority enrollment: 49%
Source: Verified school update
School Overview
The teacher population of 145 teachers has declined by 53% over five years.
Note: Data may not be displayed on any public-facing website or service that replicates or resembles a college search or review portal without prior written permission. See our Terms of Service.
The student population of New England Institute of Technology has declined by 23% over five years.
The student-teacher ratio of 13:1 has increased from 8:1 over five years.
The New England Institute of Technology diversity score of 0.68 is more than the state average of 0.00. The school's diversity has declined by 13% over five years.
Note: Data may not be displayed on any public-facing website or service that replicates or resembles a college search or review portal without prior written permission. See our Terms of Service.
Note: Data may not be displayed on any public-facing website or service that replicates or resembles a college search or review portal without prior written permission. See our Terms of Service.
Note: Data may not be displayed on any public-facing website or service that replicates or resembles a college search or review portal without prior written permission. See our Terms of Service.
Note: Data may not be displayed on any public-facing website or service that replicates or resembles a college search or review portal without prior written permission. See our Terms of Service.
Note: Data may not be displayed on any public-facing website or service that replicates or resembles a college search or review portal without prior written permission. See our Terms of Service.
Note: Data may not be displayed on any public-facing website or service that replicates or resembles a college search or review portal without prior written permission. See our Terms of Service.
Note: Data may not be displayed on any public-facing website or service that replicates or resembles a college search or review portal without prior written permission. See our Terms of Service.
Note: Data may not be displayed on any public-facing website or service that replicates or resembles a college search or review portal without prior written permission. See our Terms of Service.
Note: Data may not be displayed on any public-facing website or service that replicates or resembles a college search or review portal without prior written permission. See our Terms of Service.
Note: Data may not be displayed on any public-facing website or service that replicates or resembles a college search or review portal without prior written permission. See our Terms of Service.
Note: Data may not be displayed on any public-facing website or service that replicates or resembles a college search or review portal without prior written permission. See our Terms of Service.
Note: Data may not be displayed on any public-facing website or service that replicates or resembles a college search or review portal without prior written permission. See our Terms of Service.
Note: Data may not be displayed on any public-facing website or service that replicates or resembles a college search or review portal without prior written permission. See our Terms of Service.
Note: Data may not be displayed on any public-facing website or service that replicates or resembles a college search or review portal without prior written permission. See our Terms of Service.
Note: Data may not be displayed on any public-facing website or service that replicates or resembles a college search or review portal without prior written permission. See our Terms of Service.
Note: Data may not be displayed on any public-facing website or service that replicates or resembles a college search or review portal without prior written permission. See our Terms of Service.
College Completion Rate (Students who graduate in 4 years or more than 4 years)
Note: Data may not be displayed on any public-facing website or service that replicates or resembles a college search or review portal without prior written permission. See our Terms of Service.
Note: Data may not be displayed on any public-facing website or service that replicates or resembles a college search or review portal without prior written permission. See our Terms of Service.
Tuition and Acceptance Rate
The private state tuition of $30,000 is equal to the state average of $30,000. The private state tuition has declined by 8% over four years.
Note: Data may not be displayed on any public-facing website or service that replicates or resembles a college search or review portal without prior written permission. See our Terms of Service.
Note: Data may not be displayed on any public-facing website or service that replicates or resembles a college search or review portal without prior written permission. See our Terms of Service.
Note: Data may not be displayed on any public-facing website or service that replicates or resembles a college search or review portal without prior written permission. See our Terms of Service.
Note: Data may not be displayed on any public-facing website or service that replicates or resembles a college search or review portal without prior written permission. See our Terms of Service.
Note: Data may not be displayed on any public-facing website or service that replicates or resembles a college search or review portal without prior written permission. See our Terms of Service.
Note: Data may not be displayed on any public-facing website or service that replicates or resembles a college search or review portal without prior written permission. See our Terms of Service.
Note: Data may not be displayed on any public-facing website or service that replicates or resembles a college search or review portal without prior written permission. See our Terms of Service.
Extracurriculars
Total ExtracurricularsTotal Extra-curric.
2 extracurriculars
ExtracurricularsExtra-curric.
Club or Organization:
Student Advisory Council Phi Theta Kappa Alpha Chir Honor Society Adventurers’ Guild Club Criminal Justice Club Esports Club Game Developers’ Network Interior Design Student Alliance New England Tech Student Nurses Associaton New England Tech Golf Club
Recreational Athletic Programs:
eSports
Source: 2025 (or latest year available) Integrated Postsecondary Education Data System (IPEDS) , School Administrators
School Notes
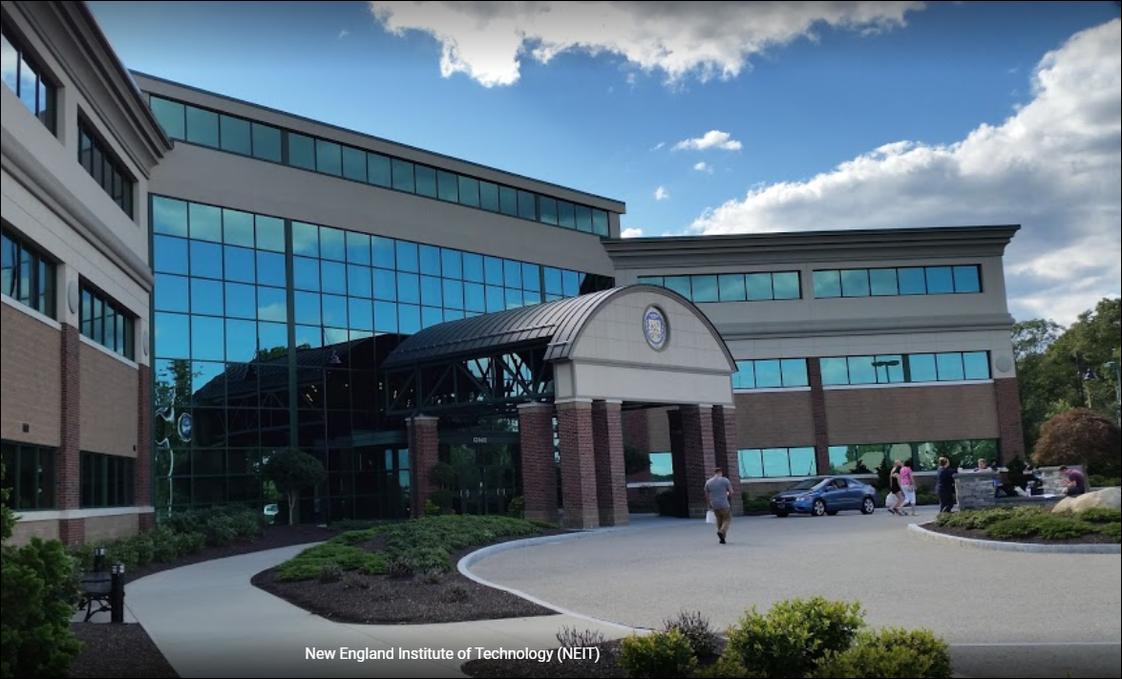
As the leader in technical career education in Southeastern New
England, New England Tech is a private, non-profit technical
college offeringAssociate's,
Bachelor's,
andGraduatein
50+ programs both online and on campus. Each one has been
thoughtfully designed with input from both educators and industry
experts. The focus at New England Tech is to give each student a
solid balance: a base of analytical skills with hands-on training.
Most of our Associate's Degree programs can be completed in as
little as 18 months and our Bachelor's of Science programs in as
little as 3 years. Today, enrollment has grown to more than 2,800
students from the 70 students enrolled in 1971. The college offers
Associate's Degree Program in Civil, Marine, Nursing, Automotive,
Business Management, Mechanical, Welding, Software, Architecture
and Design, Electronics, Mechanical Engineering Technology,
Medical, Transportation and Building Technologies. Bachelor's
Degree Programs includes Automotive Service Management Technology,
Interior Design, RN to BSN, Electronics Engineering Technology,
Architectural Building Engineering Technology, Mechanical
Engineering Technology and Business Management Technology. New
England Tech is accredited by the New England Association of
Schools and Colleges, Inc. (NEASC) and many of our programs
maintain individual accreditation. For example, our Electronics
Engineering Technology program at the Bachelor's level is
accredited by the Technology Accreditation Commission (TAC) of the
Accreditation Board for Engineering and Technology (ABET).


 and Student Involvement & Leadership.")


