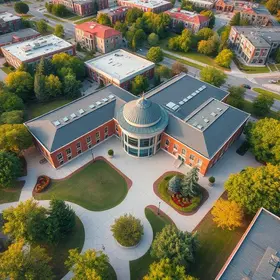
Navarro College

  • An open-door, public, comprehensive, community college, Navarro College primarily serves the educational, civic, and business communities in Navarro, Ellis, Limestone, Freestone, and Leon Counties. The College also attracts students from the rest of the state of Texas, from throughout the United States, and from many other countries, welcoming students from all cultural, educational, and socioeconomic backgrounds, Navarro College is alert to the changing educational requirements of its constituency and the social and political forces at work within communities it serves and responds to these changing needs with enthusiasm, creativity, intelligence, and hard work.

School Highlights

Navarro College serves 6,557 students (35% of students are full-time).
The college's student-teacher ratio of 37:1 is higher than the state community college average of 34:1.
Minority enrollment is 48% of the student body (majority Hispanic), which is less than the state average of 75%.

Quick Facts (26-27)

  • Enrollment: 6,557 students
  • In-state tuition: $3,388
  • Out-state tuition: $4,828
  • Student-teacher ratio: 37:1
  • Minority enrollment: 48%
  • Source: Integrated Postsecondary Education Data System (IPEDS)

School Overview

The teacher population of 179 teachers has declined by 58% over five years.
Navarro College
(TX) Community College Avg.
Carnegie Classification
Associate's Colleges
Associate's Colleges: Mixed Transfer/Career & Technical-High Traditional
Institution Level
Four or more years
At least 2 but less than 4 years
Institution Control
Public
Public
Campus Size
103 acres
Total Faculty
179 staff
73 staff
School Calendar
AccreditationAccred.
American Association of Community Colleges (AACC)

Student Body

The student population of Navarro College has declined by 8% over five years.
The student-teacher ratio of 37:1 has increased from 19:1 over five years.
The Navarro College diversity score of 0.64 is less than the state average of 0.69. The school's diversity has grown by 8% over five years.
Total Enrollment
6,557 students
4,254 students

Showing 2012–2025. Full 19-year historical data available below ↓

Student-Teacher Ratio
37:1
34:1

Showing 2008–2025. Full 19-year historical data available below ↓

# Full-Time Students
2,283 students
902 students

Showing 2012–2025. Full 19-year historical data available below ↓

# Part-Time Students
4,274 students
3,352 students

Showing 2013–2025. Full 19-year historical data available below ↓

# Enrollment Undergraduate
6,557 students
1,360 students
# Full-Time Undergraduate Students
2,283 students
869 students

Showing 2012–2025. Full 19-year historical data available below ↓

# Part-Time Undergraduate Students
4,274 students
3,370 students
Total Dormitory Capacity
861 students
251 students

Showing 2010–2021. Full 15-year historical data available below ↓

% Asian
1%
6%
% Hispanic
23%
47%

Showing 2008–2025. Full 19-year historical data available below ↓

% Black
18%
13%

Showing 2008–2025. Full 19-year historical data available below ↓

% White
52%
25%

Showing 2010–2025. Full 19-year historical data available below ↓

% Two or more races
4%
2%
% Non Resident races
1%
2%
% Unknown races
1%
5%
Diversity Score
0.64
0.69

Showing 2011–2025. Full 19-year historical data available below ↓

College Completion Rate (Students who graduate in less than 4 years)
25%
54%

Showing 2015–2025. Full 19-year historical data available below ↓

Average Graduate Earnings (10 Years)
$34,100
$33,900

Tuition & Financial Aid

The public in-state tuition of $3,388 is more than the state average of $3,345. The in-state tuition has declined by 24% over four years.
The public out-state tuition of $4,828 is less than the state average of $5,806. The out-state tuition has declined by 24% over four years.
In-State Tuition Fees
$3,388
$3,345
Out-State Tuition Fees
$4,828
$5,806
% Students Receiving Some Financial Aid
83%
88%

Showing 2013–2025. Full 19-year historical data available below ↓

Median Debt for Graduates
$11,000
$10,630

Showing 2008–2020. Full 14-year historical data available below ↓

Median Debt for Dropouts
$6,614
$5,500

Showing 2008–2020. Full 14-year historical data available below ↓

Source: 2025 (or latest year available) Integrated Postsecondary Education Data System (IPEDS) , School Administrators

School Notes

  • In Spring of 1946 a group of local citizens met to form a steering committee for the purpose of establishing a junior college in Navarro County. In a general election held July 16, 1946, voters approved the creation of Navarro Junior College and authorized a county tax to help finance the institution. In that same election voters chose a seven-member board of trustees to govern the College. The first students began classes in September, 1946. In 1951 the campus was moved to its present location, a 47 acre tract west of downtown Corsicana on State Highway 31. The campus has expanded to 103 acres with 23 buildings. Academic Programs are offered in Art, Accounting, Business Administration, Criminal Justice, Behavioral Sciences, Biology, Chemistry, Computer Science Education, English, Fine Arts, Foreign Language, Mathematics, Social Sciences, Developmental Studies, Engineering, Physical Education, Physics and Speech. Career & Technical Programs includes Accounting, Ag Mechanization, Business Administration, Customer Service, Business Information Technology, Child Development, Computer Science, Cosmetology, Criminal Justice, Fire Science, Health Profession Certificate, Paralegal (Legal Assistant), Medical Lab Technology, Multimedia Technology, Associate Degree Nursing, Licensed Vocational Nursing, LVN-RN Bridge, Occupational Therapy Assistant and Paramedic. The college is accredited by the Southern Association of Colleges and Schools.

Frequently Asked Questions

How much does Navarro College cost?
Navarro College's tuition is approximately $3,388 for In-State students and $4,828 for Out-State students.

Recent Articles

Licensure Pass Rates: What Students Should Check
Learn how to evaluate licensure pass rates before enrolling in community college career programs, compare exam results, identify warning signs, and choose training that supports professional licensing and employment goals.
Do Your Transfer Credits Count Toward Your Major?
A college course may transfer without counting toward your major. Learn how to check degree requirements, identify elective credits, avoid graduation delays, and protect your community college transfer plan.
Transfer With 45 Credits, 60 Credits, or a Degree?
Should you transfer with 45 credits, 60 credits, or an associate degree? Compare university requirements, tuition savings, graduation timelines, and transfer benefits to choose the best path for your goals.

Quick Facts (26-27)

  • Enrollment: 6,557 students
  • In-state tuition: $3,388
  • Out-state tuition: $4,828
  • Student-teacher ratio: 37:1
  • Minority enrollment: 48%
  • Source: Integrated Postsecondary Education Data System (IPEDS)

Related School Videos

Did You Know?

For Texas public community colleges, the average tuition is approximately $3,345 per year for in-state students and $5,806 for out-of-state students. For private community colleges, the average yearly tuition is approximately $13,749 per year. Read more about average community college tuition costs across the country.

The average community college acceptance rate in Texas is 74%. Read more about national community college acceptance rates.

Texas community colleges have a diversity score of 0.69, which is lower than the national average of 0.74. The most diverse community college in Texas is Houston International College Cardiotech Ultrasound School. Read more about community college diversity statistics in the USA.

Quick Links