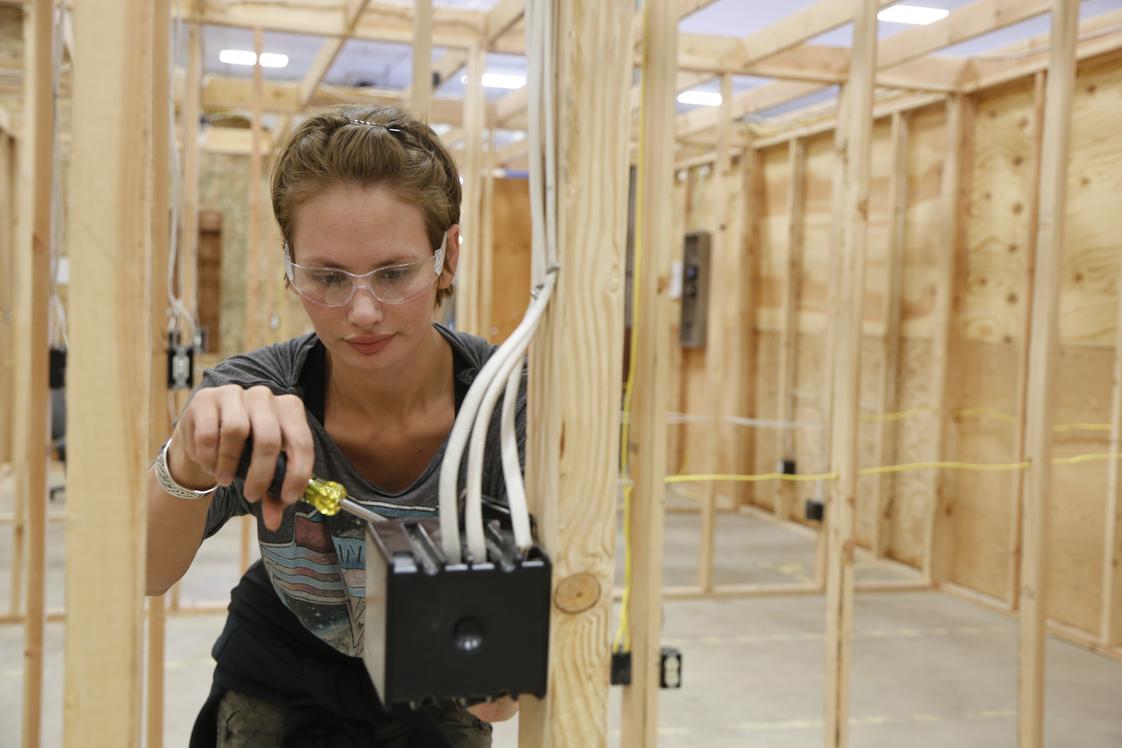
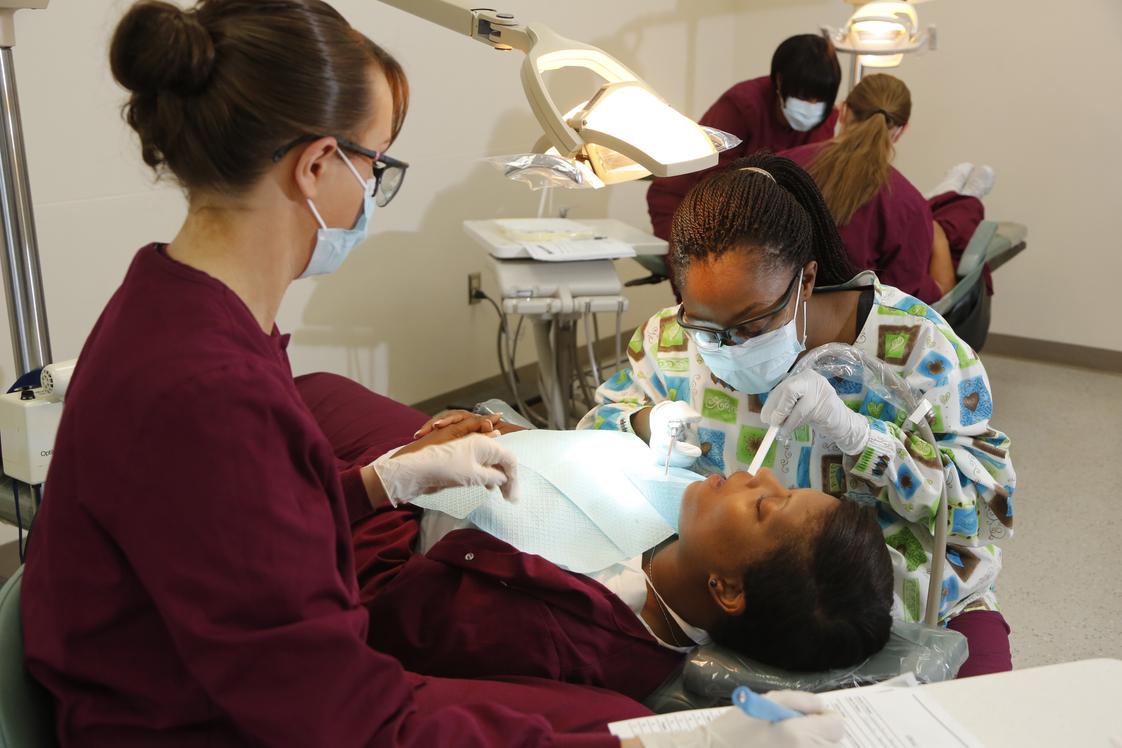
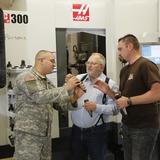
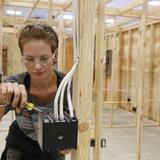
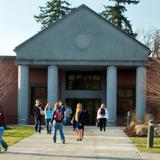
- Bates Technical College helps you realize your potential for growth and success through innovative instruction in a friendly, supportive and diverse environment. You'll achieve your career and personal goals, and help strengthen the region's social and economic vibrancy. Strong local and global partnerships with business, industry, labor and the public make Bates a respected contributor to community vitality. We offer
- two-year Associate of Applied Sciences degrees, Associate of Applied Science-Transfer degrees, certificates, industry certifications, and, in specific programs, prepares students for the achievement of state licensure.
School Highlights
Bates Technical College serves 6,574 students (48% of students are full-time).
The college's student-teacher ratio of 23:1 is higher than the state community college average of 15:1.
Minority enrollment is 50% of the student body (majority Hispanic and Asian), which is less than the state average of 56%.
Quick Facts (2026)
- Enrollment: 6,574 students
- In-state tuition: $5,151
- Out-state tuition: $5,151
- Acceptance Rate: 100%
- Student-teacher ratio: 23:1
- Minority enrollment: 50%
- Source: Verified school update
Top Rankings
Bates Technical College ranks among the top 20% of public schools in Washington for:
Category
Attribute
Debt For Students
School Overview
The teacher population of 283 teachers has stayed relatively flat over five years.
Bates Technical College
(WA) Community College Avg.
Carnegie Classification
Associate's Colleges: High Career & Technical-High Nontraditional
Baccalaureate/Associate's Colleges: Associate's Dominant
Institution Level
At least 2 but less than 4 years
Four or more years
Institution Control
Public
Public
Total Faculty
283 staff
353 staff
Student Body
The student population of Bates Technical College has grown by 95% over five years.
The student-teacher ratio of 23:1 has increased from 17:1 over five years.
The Bates Technical College diversity score of 0.70 is less than the state average of 0.75. The school's diversity has stayed relatively flat over five years.
Total Enrollment
6,574 students
5,207 students
Student-Teacher Ratio
23:1
15:1
# Full-Time Students
3,145 students
2,028 students
# Part-Time Students
3,429 students
3,179 students
# Enrollment Undergraduate
657 students
494 students
# Full-Time Undergraduate Students
3,145 students
2,028 students
# Part-Time Undergraduate Students
3,429 students
3,179 students
Total Dormitory Capacity
n/a
140 students
% American Indian/Alaskan
1%
1%
% Asian
8%
10%
% Hispanic
12%
17%
% Black
6%
7%
% White
50%
44%
% Hawaiian
1%
1%
% Two or more races
7%
8%
% Non Resident races
n/a
3%
% Unknown races
15%
9%
Diversity Score
0.70
0.75
College Completion Rate (Students who graduate in less than 4 years)
40%
57%
College Completion Rate (Students who graduate in 4 years or more than 4 years)
n/a
36%
Average Graduate Earnings (10 Years)
$37,200
$36,400
Tuition and Acceptance Rate
The public in-state tuition of $5,151 is more than the state average of $4,105. The in-state tuition has declined by 22% over four years.
The public out-state tuition of $5,151 is less than the state average of $7,359. The out-state tuition has declined by 68% over four years.
In-State Tuition Fees
$5,151
$4,105
Out-State Tuition Fees
$5,151
$7,359
% Students Receiving Some Financial Aid
40%
58%
Median Debt for Graduates
$6,187
$11,417
Median Debt for Dropouts
$4,750
$6,192
Acceptance Rate
100%
99%
Extracurriculars
Total ExtracurricularsTotal Extra-curric.
2 extracurriculars
ExtracurricularsExtra-curric.
Club or Organization:
Recreational Athletic Programs:
Associated Student Government clubs
Recreational Athletic Programs:
Intramural sports
Source: 2024 (or latest year available) Integrated Postsecondary Education Data System (IPEDS) , School Administrators
School Notes
- At Bates Technical College, we focus on career education. Nestled in the shadow of Mount Rainier in the state`s second-largest county, the college boasts three vibrant campuses throughout Tacoma - including a new Advanced Technology Building that houses engineering, information technology, and digital media programs.You`ll find a variety of interesting, satisfying career education programs that deliver practical, concentrated hands-on training, with a goal of providing an affordable, accessible path toward successful employment.
- Sample of notable school alumni/alumnae:
- Norman Bellamy, Bates Technical College Foundation board member -
Frequently Asked Questions
How much does Bates Technical College cost?
Bates Technical College's tuition is approximately $5,151 for In-State students and $5,151 for Out-State students.
What is the acceptance rate of Bates Technical College?
The acceptance rate of Bates Technical College is 100%, which is higher than the state average of 99%.
Who are famous alumni from Bates Technical College?
Bates Technical College famous alumni include: Norman Bellamy, Bates Technical College Foundation board member.
What is Bates Technical College's ranking?
Bates Technical College ranks among the top 20% of community college in Washington for: Least debt for graduating students.
In what neighborhood is Bates Technical College located?
Bates Technical College is located in the New Tacoma neighborhood of Tacoma, WA.
School Calendar
View the Bates Technical College yearly calendar below.
Recent Articles

Giving Back: How to Choose the Right Community College for Nursing, IT, or Business in 2026
Practical guidance for selecting the best community college for Nursing, IT, or Business in 2026, with expert tips on fit, outcomes, and career alignment.

How Community College Students Can Build a Transfer-Ready Portfolio for 2026
Learn how community college students can build a transfer-ready portfolio for 2026 admissions with coursework, projects, recommendations, and planning tips.

Community Colleges on the President’s Honor Roll for Service
How community colleges earn the President’s Honor Roll for Community Service, with 2026 examples, impact data, and student opportunities.

