Pioneer Pacific College (Closed 2021)

4145 SW Watson Ave. #300
Beaverton, OR 97005
  • Pioneer Pacific College is uncompromisingly dedicated to helping people improve their lives through high-quality, college-level, career education.

School Highlights

Pioneer Pacific College served 740 students (58% of students were full-time).
The college's student:teacher ratio of 7:1 was lower than the state community college average of 14:1.
Minority enrollment was 34% of the student body (majority Hispanic), which was less than the state average of 40%.

School Overview

Pioneer Pacific College
(OR) Community College Avg.
Carnegie Classification
Baccalaureate/Associate's Colleges: Associate's Dominant
Associates Colleges
Institution Level
Less than 2 yrs
At least 2 but less than 4 years
Institution Control
Public
Public
Total Faculty
107 staff
221 staff
This chart display total faculty of Pioneer Pacific College and community college average number of faculty in OR by year, with the latest 2019-20 school year data.

Student Body

Total Enrollment
740 students
1,724 students
This chart display the total enrollment of Pioneer Pacific College and community college average number of enrollment of OR by year, with the latest 2019-20 school year data.
Student : Teacher Ratio
7:1
14:1
This chart display the student staff ratio of Pioneer Pacific College and community college average student staff ratio of OR by year, with the latest 2019-20 school year data.
# Full-Time Students
429 students
767 students
This chart display the total number of Full-time students enrollment of Pioneer Pacific College and average number of community college Full-time students enrollment of OR by year, with the latest 2019-20 school year data.
# Part-Time Students
311 students
957 students
This chart display the total number of Part-time students enrollment of Pioneer Pacific College and average number of community college Part-time students enrollment of OR by year, with the latest 2019-20 school year data.
This chart display the Full-time students and Part-time students enrollment breakdown of Pioneer Pacific College.
This chart display community college average Full-Time students and Part-Time students enrollment breakdown of OR.
# Enrollment Undergraduate
238 students
278 students
# Full-Time Undergraduate Students
429 students
767 students
This chart display the total number of Full-time undergraduate students enrollment of Pioneer Pacific College and average number of community college Full-time undergraduate  students enrollment of OR by year, with the latest 2019-20 school year data.
# Full-Time Graduate Students
n/a
104 students
# Part-Time Undergraduate Students
n/a
957 students
# Part-Time Graduate Students
n/a
220 students
Total Dormitory Capacity
n/a
270 students
% American Indian/Alaskan
1%
1%
This chart display the percentage of American Indian/Alaskan students in Pioneer Pacific College and the percentage of American Indian/Alaskan community college students in OR by year, with the latest 2019-20 school year data.
% Asian
3%
4%
This chart display the percentage of Asian students in Pioneer Pacific College and the percentage of Asian community college students in OR by year, with the latest 2019-20 school year data.
% Hispanic
16%
16%
This chart display the percentage of Hispanic students in Pioneer Pacific College and the percentage of Hispanic community college students in OR by year, with the latest 2019-20 school year data.
% Black
3%
2%
This chart display the percentage of Black students in Pioneer Pacific College and the percentage of Black community college students in OR by year, with the latest 2019-20 school year data.
% White
66%
60%
This chart display the percentage of White students in Pioneer Pacific College and the percentage of White community college students in OR by year, with the latest 2019-20 school year data.
% Hawaiian
n/a
1%
% Two or more races
5%
4%
This chart display the percentage of Two or more races students in Pioneer Pacific College and the percentage of Two or more races community college students in OR by year, with the latest 2019-20 school year data.
% Non Resident races
1%
2%
This chart display the percentage of Non Resident students in Pioneer Pacific College and the percentage of Non Resident community college students in OR by year, with the latest 2019-20 school year data.
% Unknown races
5%
10%
This chart display the percentage breakdown of students of all ethnic groups in Pioneer Pacific College.
This chart display the percentage breakdown of students of all ethnic groups in OR.
Diversity Score
0.53
0.60
This chart display the diversity score of Pioneer Pacific College and the community college average diversity score of OR by year, with the latest 2019-20 school year data.
College Completion Rate (Students who graduate in less than 4 years)
n/a
22%
College Completion Rate (Students who graduate in 4 years or more than 4 years)
1.39%
n/a
Average Graduate Earnings (10 Years)
$29,800
$33,800
This chart display average graduate earnings (10 Years) of Pioneer Pacific College and community college average graduate earnings (10 Years) of OR by year, disaggregated by student subgroups with the latest 2012-13 school year data.

Tuition and Acceptance Rate

In-State Tuition Fees
$14,004
$4,476
This chart display tuition fees for an in-state student of Pioneer Pacific College and the public community college average tuition fees for an in-state student of OR by year, with the latest 2019-20 school year data.
Out-State Tuition Fees
$14,004
$7,489
This chart display tuition fees for an out-of-state student of Pioneer Pacific College and the public community college average tuition fees for an out-of-state student of OR by year, with the latest 2019-20 school year data.
% Students Receiving Some Financial Aid
80%
86%
This chart display the percent of students who is receiving some financial aid in Pioneer Pacific College and the percent of community college students who is receiving some financial aid in OR by year, with the latest 2019-20 school year data.
Median Debt for Graduates
$14,855
$12,875
This chart display median debt for students who have completed a certificate or degree in Pioneer Pacific College and average median debt for community college students who have completed a certificate or degree in OR by year, with the latest 2019-20 school year data.
Median Debt for Dropouts
$5,700
$6,334
This chart display median debt for students who have not completed a certificate or degree in Pioneer Pacific College and average median debt for community college students who have not completed a certificate or degree in OR by year, with the latest 2019-20 school year data.
Acceptance Rate
n/a
88%
Source: 2020 (or latest year available) Integrated Postsecondary Education Data System (IPEDS) , School Administrators

School Notes

  • The school is a highly focused private career college offering certificate, associate, and bachelor's degree programs. With locations in Clackamas, Eugene/Springfield, Portland(Oregon Culinary Institute) and two in Wilsonville, the school serves students who are beginning their education, as well as those who are returning to school for further training. Founded in 1981 as Skilltronics, Inc. in Corvallis, Oregon, the school began as a unique training program for students interested in entering the growing electronics industry. In 1989 the school is purchased by Pacific Education Corporation and renamed Pioneer Pacific college. It immediately expanded its range of programs to better meet the requirements of employers in both the private and public sector. In the year 2000, the main campus moved to a new location in Wilsonville, Oregon. The completely renovated site provides additional facilities and a more collegiate atmosphere. In 2004, Pioneer Pacific begins offering its first baccalaureate degree program ' the Bachelor of Science in Information Technology, offered through the main Campus in Wilsonville. Another highlight of the year is the opening of the Health Career Institute adjacent to the Wilsonville campus. Serving as the latest example of the school's commitment to better serving students and the community, this 21,000 square foot facility is home to many new and exciting health-related career education programs. The college offer 10 Associate Degree Programs, 1 Certificate Program and 7 Diploma Programs, as well as bachelor degrees in Criminal Justice, Healthcare Administration, Business Management and Information Technology. The Accrediting Council for Independent Colleges and Schools accredits Pioneer Pacific College to award certificates, diplomas and occupational associate's degrees. The Accrediting Council for Independent Colleges and Schools is listed as a nationally-recognized accrediting agency by the United States Department of Education.

Frequently Asked Questions

How much does Pioneer Pacific College cost?
Pioneer Pacific College's tuition is approximately $14,004 for In-State students and $14,004 for Out-State students.

Recent Articles

Land One of the Fastest Growing Jobs with a Community College Degree
Are you looking for your career path? Consider some of the jobs boasting the fastest job growth today that only need a community college degree.
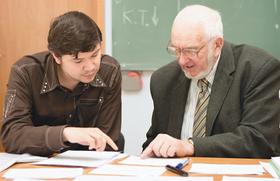
Establishing Good Relationships with Instructors
Learn how to establish good relationships with community college instructors, and how they can be helpful for your academics.
Community Colleges: A to Z
February 21, 2024
Community Colleges: A to Z
Explore the diverse landscape of community colleges with our comprehensive guide, 'Community CollegeS: A to Z.' From academic programs to student support services, this article provides a look at everything community colleges have to offer.

Did You Know?

For Oregon public community colleges, the average tuition is approximately $4,476 per year for in-state students and $7,489 for out-of-state students. Read more about average community college tuition costs across the country.

The average community college acceptance rate in Oregon is 92%. Read more about national community college acceptance rates.

Oregon community colleges have a diversity score of 0.60, which is lower than the national average of 0.70. The most diverse community college in Oregon is Mt Hood Community College. Read more about community college diversity statistics in the USA.

Quick Links